Published in Advances in Space Research, Volume 34,
Issue 12, p. 2470-2477.
astro-ph/0303115
For a PDF version of the article, click
here.
THE X-RAY BACKGROUND AND THE DEEP X-RAY SURVEYS
R. Gilli
Istituto
Nazionale di Astrofisica (INAF),
Osservatorio Astrofisico di Arcetri, Largo E. Fermi
5, 50125 Firenze, Italy
Abstract.
The deep X-ray surveys performed by the two major X-ray observatories
on flight, Chandra and XMM, are being resolving the bulk of the cosmic
X-ray background (XRB) in the 2-10 keV energy band, where the sky
flux is dominated by extragalactic emission. Although the actual
fraction depends on the absolute sky flux, which is measured with an
uncertainty of ~ 40%, most of the XRB is already
resolved. Optical identifications of the X-ray sources in the deep
surveys are being showing that these are mainly AGN, most of which
being obscured as predicted by population synthesis models. However,
first results indicate that the redshift distribution of the sources
making the XRB seems to peak at much lower redshift than predicted by
the models. In this article I will briefly review and discuss the
measurements of the XRB spectrum and the AGN synthesis models of the
XRB. Then, I will introduce the Chandra and XMM deep X-ray surveys,
mainly focusing on the Chandra Deep Field North and South. Finally,
the properties of the X-ray sources populating the deep surveys will
be described and compared with the predictions of the most recent
synthesis models.
Table of Contents
 INTRODUCTION
- THE COSMIC X-RAY BACKGROUND MEASUREMENTS
- AGN POPULATION SYNTHESIS MODELS
- THE DEEP X-RAY SURVEYS
- The sources populating the Deep Surveys
- The source redshift distribution
- DO OBSCURED AGN EVOLVE LIKE STARBURST GALAXIES?
- CONCLUSIONS
- REFERENCES
1. INTRODUCTION
The origin of the X-ray background in the 2-10 keV energy range has
been finally understood. The extremely deep surveys by Chandra in the
Deep Field South
(Giacconi et al. 2002;
Rosati et al. 2002)
and Deep Field North
(Brandt et al. 2001;
Barger et al. 2002)
have shown that
most, if not all, the XRB emission in that energy range has been
resolved into single sources. In particular, the optical and X-ray
properties of the sources in the deep fields are showing that the main
contribution is provided by a population of obscured AGN. This
confirms the main prediction of population synthesis models (e.g.
Setti & Woltjer 1989;
Comastri et al. 1995;
Fabian et al. 1999;
Gilli, Salvati & Hasinger 2001),
which explain the XRB spectrum in
the ~ 1 - 100 keV band as the emission integrated over cosmic time
of unobscured and obscured AGN, the latter being more numerous by a
factor of ~ 4 - 10. Once the origin of the 2-10 keV XRB is finally
explained, the results from the deep surveys, combined with synthesis
models, should put tighter constraints on the cosmological properties of
the sources making the XRB, like their X-ray luminosity function and
evolution (especially those of obscured AGN, which are still
completely unknown), as well as their average obscuration as a
function of redshift and luminosity.
2. THE COSMIC X-RAY BACKGROUND MEASUREMENTS
At present, in the 10-100 keV range, where the bulk of the XRB energy
resides, the only available measurements are those performed in the
late 1970s by HEAO-1
(Marshall et al. 1980;
Gruber 1992).
The data showed that the XRB spectrum has a characteristic "bell" shape
peaking at ~ 30 - 40 keV, which, at lower energies, can be
approximated by a power-law with photon index
 = 1.4. A recent
reanalysis of HEAO-1 data by
Gruber et al. (1999)
confirmed those
earlier results, but also showed that the calibration uncertainties
among HEAO-1 detectors are of the order of 10% in the overlapping
energy bands (Fig. 1). The situation is more
complicated at lower
energies where a number of measurements have been obtained. While the
spectral slope of the 2-10 keV XRB has always been found to have
small variations around
= 1.4, there are
significant
discrepancies in the spectral normalization. From the highest (11.5
keV s-1 sr-1 cm-2 keV-1 ;
SAX,
Vecchi et al. 1999)
to the lowest measured value (8 keV s-1 sr-1
cm-2 keV-1 ; HEAO-1,
Marshall et al. 1980)
the variation is of the order of
~ 40%. The most recent measuments have been obtained by
Kushino et al. (2002)
from a combination of 91 ASCA GIS fields, with a total sky
coverage of 50 deg2, and by
Lumb et al. (2002)
from a combination
of 8 XMM pointings covering 6.5 deg2 in total. The XRB spectral
slope is found to be
= 1.412 ±
0.032 and
= 1.42 ± 0.03
in the ASCA and XMM data, respectively (errors are at 90%
confidence level), again very close to
= 1.4. The power-law
normalizations (9.66 ± 0.07 and
11.1 ± 0.32 keV s-1 sr-1 cm-2
keV-1 for the ASCA
and XMM data, respectively, including the resolved bright sources) are
within the range already spanned by previous missions, but do not
suggest that the measurements of the XRB intensity are converging to a
well constrained value. Interestingly, all the measurements of the
2-10 keV XRB intensity since HEAO-1 are higher than the HEAO-1 value.
= 1.4. A recent
reanalysis of HEAO-1 data by
Gruber et al. (1999)
confirmed those
earlier results, but also showed that the calibration uncertainties
among HEAO-1 detectors are of the order of 10% in the overlapping
energy bands (Fig. 1). The situation is more
complicated at lower
energies where a number of measurements have been obtained. While the
spectral slope of the 2-10 keV XRB has always been found to have
small variations around
= 1.4, there are
significant
discrepancies in the spectral normalization. From the highest (11.5
keV s-1 sr-1 cm-2 keV-1 ;
SAX,
Vecchi et al. 1999)
to the lowest measured value (8 keV s-1 sr-1
cm-2 keV-1 ; HEAO-1,
Marshall et al. 1980)
the variation is of the order of
~ 40%. The most recent measuments have been obtained by
Kushino et al. (2002)
from a combination of 91 ASCA GIS fields, with a total sky
coverage of 50 deg2, and by
Lumb et al. (2002)
from a combination
of 8 XMM pointings covering 6.5 deg2 in total. The XRB spectral
slope is found to be
= 1.412 ±
0.032 and
= 1.42 ± 0.03
in the ASCA and XMM data, respectively (errors are at 90%
confidence level), again very close to
= 1.4. The power-law
normalizations (9.66 ± 0.07 and
11.1 ± 0.32 keV s-1 sr-1 cm-2
keV-1 for the ASCA
and XMM data, respectively, including the resolved bright sources) are
within the range already spanned by previous missions, but do not
suggest that the measurements of the XRB intensity are converging to a
well constrained value. Interestingly, all the measurements of the
2-10 keV XRB intensity since HEAO-1 are higher than the HEAO-1 value.
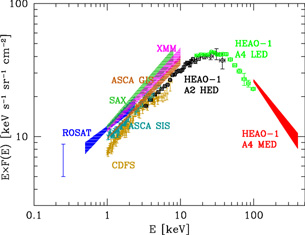 |
Figure 1. The extragalactic X-ray
background spectrum from 0.2 to 400
keV. Different colors correspond to measurements by different
missions/instruments as labeled. The reference list for the shown data
is the following: ROSAT 0.25 keV
(Warwick & Roberts 1998);
ROSAT 0.5-2.4 keV
(Georgantopoulos et al. 1996);
HEAO-1 A2 HED + A4 LED
(Gruber 1992;
Gruber et al. 1999);
HEAO-1 A4 MED
(Kinzer et al. 1997);
SAX
(Vecchi et al. 1999);
ASCA SIS
(Gendreau et al. 1995);
ASCA GIS
(Kushino et al. 2002);
XMM
(Lumb et al. 2002);
CDFS
(Tozzi et al. 2001a). |
3. AGN POPULATION SYNTHESIS MODELS
In 1989, when the resolved XRB fraction was just a few percent,
Setti & Woltjer (1989)
proposed that the flat slope of the 2-10 keV XRB
was due to a population of obscured AGN in addition to the bright
unobscured AGN with steep spectra observed at that time. Since then, a
number of models have been worked out and refined constantly
(Madau, Ghisellini & Fabian 1994;
Comastri et al. 1995;
Pompilio, La Franca & Matt 1999;
Wilman & Fabian 1999).
With the increasing sensitivity
of recent X-ray surveys, the population of obscured AGN emerged (see e.g.
Mushotzky et al. 2000),
and the main prediction of the AGN
synthesis models was then confirmed. However, given the large number
of uncertain parameters involved, it is crucial to check synthesis
models against the largest number of observational constraints. The
main uncertainties are related to unobscured AGN. While the X-ray
luminosity function (XLF) and evolution of unobscured AGN are rather
well known (e.g.
Miyaji, Hasinger & Schmidt 2000),
nothing is known about obscured AGN.
Comastri et al. (1995)
showed that, assuming for
the obscured AGN a distribution of absorbing columns and the same
evolution and XLF (upscaled by a factor of a few) of unobscured ones,
it was possible to fit the full XRB spectrum in the ~ 1 - 100 keV
band, as well as the integral counts (logN-logS relation) in the 0.5-2
keV and 2-10 keV energy bands. Also, the redshift distribution of AGN
detected in ROSAT and HEAO-1 samples (at limiting fluxes of
f0.5-2 ~ 10-14 erg cm-2
s-1 and
f2-10 ~ 3 × 10-11 erg cm-2
s-1 ,
respectively) were in good agreement with the model
expectations. Later, more constraints became available. The local
ratio between obscured and unobscured AGN (in the Seyfert luminosity
regime) was found to be ~ 4
(Maiolino & Rieke 1995),
and the column density distribution of local Seyfert 2s was determined
(Risaliti et al. 1999).
Using these new constraints it was shown
(Gilli, Risaliti & Salvati 1999)
that, if the column density distribution in
obscured AGN is the same at all redshifts and luminosities, then
additional obscured sources at moderate/high redshifts are required to
match the XRB constraints.
Gilli, Salvati & Hasinger (2001,
hereafter GSH01) proposed that obscured sources evolve slightly faster than
unobscured ones. In particular they favored a model (model B) where
the ratio between obscured and unobscured AGN increases from 4 at
z = 0 to 10 at z = 1.3, where both populations stop
evolving. This
model was able to reproduce the broad set of observational constraints
used by Comastri et al., furthermore extending the agreement to lower
fluxes. In particular, the redshift distribution of soft X-ray
selected AGN in the ROSAT Ultra Deep Survey (UDS,
Lehmann et al. 2001)
at a limiting flux of
f0.5-2 ~ 10-15 erg cm-2
s-1 was nicely
reproduced, as well as that of hard X-ray selected AGN in the ASCA
Large Sky Survey
(Akiyama et al. 2000)
at a limiting flux of
f2-10 ~ 10-13 erg cm-2
s-1 . Moreover, AGN synthesis models showed
that, while the XRB spectrum can be simply fitted with a population of
Seyfert 2 galaxies in addition to unobscured AGN, the ASCA and
BeppoSAX source counts in the hard band are matched only by assuming a
population of luminous obscured AGN, the so-called QSO2s (GSH01;
Comastri et al. 2001).
It is here noted that the main contribution to
the source counts is expected to be produced by QSO2s with column
densities in the range logNH = 22 - 23, while the
contribution of Compton thick QSO2s is expected to be negligible.
4. THE DEEP X-RAY SURVEYS
A number of deep (~ Ms) and moderately deep (~ 200 ks)
X-ray surveys are being conducted in different sky fields with Chandra
and XMM.
The Chandra Deep Field North (CDFN,
Brandt et al. 2001)
and the Chandra Deep Field South (CDFS,
Giacconi et al. 2002;
Rosati et al. 2002)
have been observed with the ACIS-I array for 2 Ms and 1 Ms
respectively, and represent the two deepest X-ray surveys to date. In
the 2 Ms CDFN the achieved sensitivity limit is
~ 1.5 × 10⁻¹⁷
erg cm-2 s-1 in the soft band and
~ 1.0 × 10⁻¹⁶ erg cm-2 s-1 in the
hard band
(Alexander et al. 2002).
In the CDFS the sensitivity limits of
f0.5-2 ~ 5.5 × 10⁻¹⁷ erg
cm-2 s-1 and
f2-10 ~ 4.5 × 10⁻¹⁶
erg cm-2 s-1 obtained by
Rosati et al. (2002)
have been pushed to f0.5-2 ~ 2.4 ×
10-17 erg cm-2 s-1 and
f2-10 ~ 2.1 × 10⁻¹⁶
erg cm-2 s-1 by refining the detection techniques
(Moretti et al. 2002).
The Chandra ACIS-I observations of these fields have been complemented
with deep XMM exposures: 180 ks and 370 ks of clean XMM data have been
obtained for the CDFN
(Miyaji et al. 2002)
and the CDFS
(Hasinger et al. 2002),
respectively. The full source catalogs of the 1 Ms ACIS-I
observations of the CDFN and CDFS have been already released
(Brandt et al. 2001;
Giacconi et al. 2002),
while the additional 1 Ms ACIS-I
observation of the CDFN and the XMM observations of the CDFN and CDFS
are actually under analysis and only preliminary results are available
(Alexander et al. 2002;
Miyaji et al. 2002;
Hasinger et al. 2002).
Deep Chandra HRC and XMM exposures are on going in the
Lockman Hole (see
Hasinger et al. 2001
for the analysis of the first
XMM data), where the deepest ROSAT and ASCA surveys were already
performed (the ROSAT UDS,
Lehmann et al. 2001,
and the ASCA Deep Survey,
Ishisaki et al. 2001).
Other examples of combined Chandra/XMM
deep surveys are being carried out in the Lynx field
(Stern et al. 2002),
in the Groth-Westphal strip
(Miyaji et al. 2002)
and in the
13hr field (Page et al. 2002). A summary of the main deep and
moderately deep Chandra/XMM surveys is shown in
Table 1.
Table 1. Summary of the main
deep and moderately deep Chandra/XMM surveys.
|
| Survey |
RA |
DEC |
X-ray data |
f0.5-2 a |
f2-10 b |
Nc |
Reference |
| |
(J2000) |
|
|
|
|
|
|
| CDFN |
189.200 |
62.231 |
2 Ms Chandra ACIS-I |
0.1 |
0.1 |
503 |
1 |
| |
|
|
180 ks XMM |
4 |
2 |
~ 200 |
2 |
| CDFS |
53.116 |
-27.808 |
1 Ms Chandra ACIS-I |
0.5 |
0.4 |
346 |
3,4 |
| |
|
|
370 ks XMM |
|
|
|
5 |
| Lockman Hole |
163.179 |
57.480 |
300 ks Chandra HRC |
|
|
|
|
| |
|
|
100 ks XMM |
3.1 |
1.4 |
~ 200 |
6 |
| Lynx Field |
132.229 |
44.909 |
180 ks Chandra ACIS-I |
1.7 |
1.3 |
153 |
7 |
| |
|
|
140 ks XMM |
|
|
|
|
| Groth Strip |
214.429 |
52.474 |
200 ks Chandra ACIS-I |
|
|
|
|
| |
|
|
80 ks XMM |
6 |
4 |
~ 150 |
2 |
| 13hr field |
203.654 |
37.912 |
120 ks Chandra ACIS-I |
|
|
214 |
8 |
| |
|
|
130 ks XMM |
5 |
~ 3 |
216 |
8 |
|
a Limiting flux in the 0.5-2
keV band in units of
10-16 erg cm-2 s-1 .
b Limiting flux in the 2-10 keV band in units of
10-15 erg cm-2 s-1 .
c Number of detected sources.
References: 1)
Alexander at al. (2002);
2) Miyaji et al. (2002);
3) Giacconi et al. (2002);
4) Rosati et al. (2002);
5) Hasinger et al. (2002);
6) Hasinger et al. (2001);
7) Stern et al. (2002);
8) Page et al. (2002). |
In the soft band, the deepest observations are detecting sources about
two orders of magnitude fainter than those observed by the ROSAT
UDS. The progress in the hard X-rays is even higher, since Chandra is
now detecting sources ~ 300 times fainter than those detected in
the ASCA Deep Survey.
As shown by
Tozzi et al. (2001a),
the integrated emission of all the
CDFS sources has already resolved the 2-10 keV background flux
measured by HEAO-1. Furthermore, the stacked spectrum of the whole
CDFS sample is well described by a powerlaw with
= 1.4 (Tozzi
et al. 2001a), in excellent agreement with the measurements of the XRB
spectral slope in that energy range (see
Fig. 1).
The soft and hard logN-logS calculated in the CDFS and CDFN are
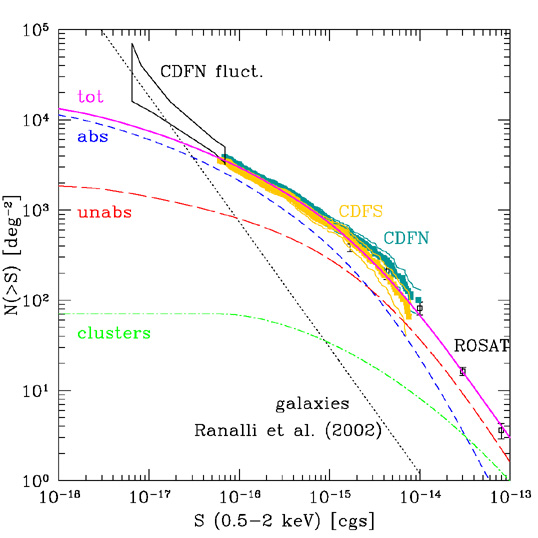
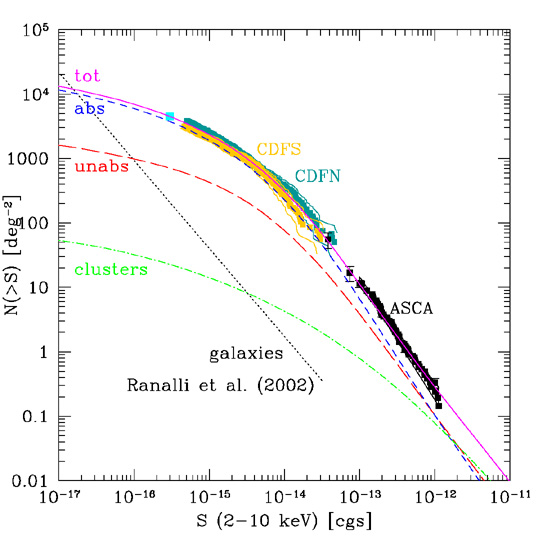
confirming the predictions by AGN synthesis models. As shown in
Fig. 2,
the logN-logS curve for model B of GSH01, which is the summed
contribution of absorbed AGN, unabsorbed AGN and clusters of galaxies,
can reproduce the CDFN and CDFS data at all fluxes. Some deviations
are observed in the soft logN-logS when considering the data from the
CDFN fluctuation analysis
(Miyaji and Griffiths 2002),
which are
higher than the model expectations. However, as shown in
Fig. 2 (left),
at those faint fluxes a population of normal/starburst galaxies is
expected to provide a major contribution
(Ptak et al. 2001;
Ranalli, Comastri & Setti 2002).
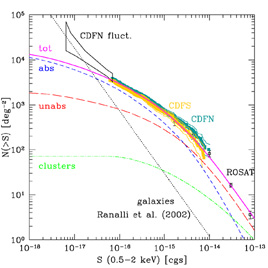 |
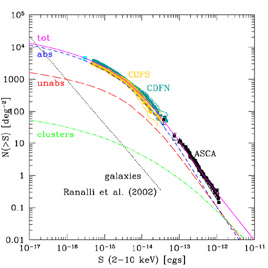 |
Figure 2. Soft (left) and hard
(right) logN-logS compared with the
predictions of model B by GSH01. Different curves correspond to the
contribution of different classes of objects as labeled. The galaxy
counts predicted by the
Ranalli et al. (2002)
model are also plotted as a dotted line. CDFS and CDFN data are from
Rosati et al. (2002) and
from Brandt et al. (2001).
The CDFN fluctuation analysis box is adapted from
Miyaji & Griffiths (2002).
ROSAT data are from
Miyaji et al. (2000).
ASCA data (black squares) at
f2-10 = 4 × 10-14,
7 × 10-14 and > 10-13 erg cm-2
s-1 are from
Ogasaka et al. (1998),
Ueda (2001) and
Cagnoni et al. (1998),
respectively. The deepest datapoint in the hard logN-logS is from
Moretti et al. (2002). |
4.1. The sources populating the Deep Surveys
Due to the extremely faint X-ray fluxes sampled by the deep surveys,
for standard X-ray to optical flux ratios, 8-10 meter class telescopes
are needed for the optical followup (see
Hornschemeier 2002
for a review). Optical spectra of the X-ray sources in the CDFN are being
obtained at Keck
(Barger et al. 2002),
while the VLT is primarily
exploited for optical spectroscopy of CDFS sources (Szokoly et al. in
preparation; see also Hasinger et al. 2002). The spectroscopic
completeness in the CDFS and CDFN is roughly 40 - 50%, but it
increases up to ~ 80% when considering the inner part of the
fields and sources with X-ray fluxes well above the survey sensitivity
limit. A direct redshift estimate is not possible for a significant
fraction of X-ray sources even with 10m class telescopes: ~ 25%
of the X-ray sources have counterparts fainter than R = 25, while ~ 15%
do not have any counterpart down to R magnitudes of 26.1-26.7
(Giacconi et al. 2002).
Nevertheless, photometric redshifts are being
determined for optically faint sources. The counterparts of
the X-ray sources reveal a broad variety of optical properties. Broad
line and narrow line AGN are commonly found, but there are also
sources with no obvious high-excitation emission lines in their
spectra. When the optical classification is uncertain, the X-ray
properties such as the X-ray luminosity and hardness ratio, in
addition to the X-ray to optical flux ratio (fx /
fopt), can be used
to discriminate between nuclear and stellar activity (see e.g.
Hasinger et al. 2002).
As shown by Hornschemeier et al. (2002)
and Giacconi et al. (2002),
about 15 - 20% of the sources populating
the deep X-ray surveys have
fx / fopt values typical of
normal/starbursts galaxies, with this fraction being higher in the
soft band and towards faint fluxes. On the contrary, the contribution
of non-active galaxies is negligible when selecting sources with 2-10
keV fluxes above a few
× 10-15 erg cm-2 s-1 .
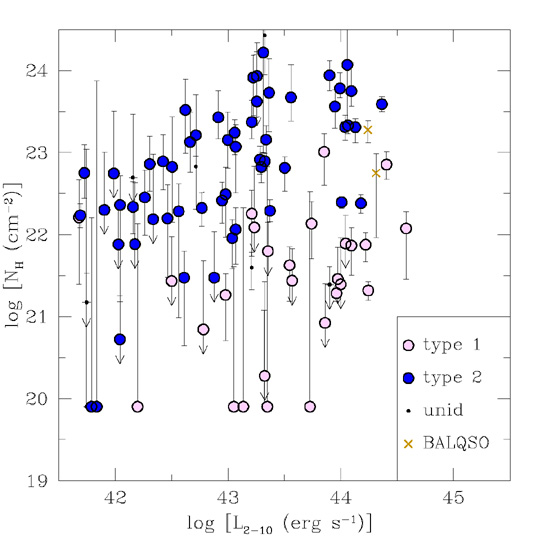
In Fig. 3 (left panel) the absorbing column of
CDFS sources, measured
from the X-ray spectral fit, is plotted against their rest frame,
intrinsic (i.e. de-absorbed) X-ray luminosity in the 2-10 keV band
(L2-10), calculated assuming H0 = 50
km s-1 Mpc-1 and
q0 = 0.5. When the photon statistics is low, the
spectral index is fixed to
= 1.8 and the
absorbing column measured
accordingly. Different symbols correspond to different optical types
(only sources with
f2-10 > 5 × 10-16 erg
cm-2 s-1 and good
spectroscopic redshift are shown). A fraction of AGN with broad
optical lines are found to have X-ray absorption in excess of
1022cm-2 , confirming the optical to X-ray
classification mismatch
already observed in shallower X-ray surveys (e.g. HELLAS,
Fiore et al. 2001;
Comastri et al. 2001).
A number of sources are found to have
L2-10 > 1044erg s-1 and
NH > 1022cm-2 , which can be well
considered the faint tail of the QSO2 population (a similar result has
been found in the Lockman Hole by
Mainieri et al. 2002a).
Given the
relatively low space density of luminous sources, the high-luminosity
tail of the QSO2 population is best sampled by shallow, wide area
surveys.
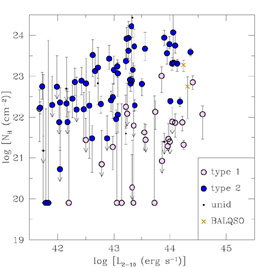 |
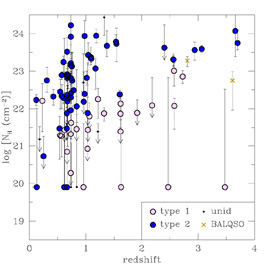 |
Figure 3. Left: rest-frame absorbing
column density versus rest
frame, intrinsic (de-absorbed) luminosity in the 2-10 keV band for the
CDFS sources with
f2-10 > 5 × 10-16 erg
cm-2 s-1 (a cosmological model
with H0 = 50 km s-1 Mpc-1 and
q0 = 0.5 has been
assumed). Different symbols represent different optical types as
labeled. Type 1 AGN do show broad lines, while type 2 AGN do not (see
Szokoly et al. in preparation for the detailed classification
criteria). Sources with uncertain classification are plotted as dark
dots. Obscured QSOs populate the upper-right corner of the plot (with
L2-10 > 1044erg s-1 and
NH > 1022cm-2 ). As already
observed in shallower surveys (e.g. HELLAS,
Fiore et al. 2001)
several broad line AGN are found to have X-ray absorption in excess of
1022cm-2 . Right: rest-frame absorbing
column density versus
redshift for the same source sample. Symbols are the same as in the
left panel. |
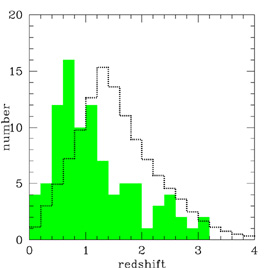
4.2. The source redshift distribution
Most of the sources identified in the CDFN, CDFS and Lockman Hole are
found to be at z < 1 (see Fig. 10 of
Barger et al. 2002
for the CDFN; Fig. 9 of
Tozzi et al. 2001b
for the CDFS; Fig. 1 of
Mainieri et al. 2002b
for the Lockman Hole). Synthesis models of the X-ray
background predict that at these faint fluxes the X-ray source
redshift distribution is peaked at z ~ 1.3 - 1.5, in contrast with
the observed data. A direct comparison between the published
distributions and the model predictions is however complicated by the
following effects:
1) optical identifications are still far from complete. In general,
the still unidentified sources are expected to be at higher
redshift than those already observed.
2) ~ 15 - 20% of the sources populating the deep surveys are
non-active galaxies at z < 1.
3) given the narrow field of view of the deep surveys (0.1-0.2
deg2) the redshift distribution could be dominated by the
presence of large scale structures. This is indeed the case in the CDFS
(Gilli et al. 2003),
where narrow spikes in the source redshift distribution have been found
at z = 0.67 and z = 0.73, and
also in the CDFN, where redshift structures have been found at
z = 0.84 and z = 1.02
(Barger et al. 2002).
Nevertheless, the spectroscopic completeness can be significantly
increased by selecting sources with an X-ray flux well above the
survey limit in those subregions with higher optical coverage. Also, if
only bright and hard X-ray selected sources are considered, the
percentage of non-AGN objects drops dramatically.
In Fig. 4 (left) it is shown the redshift
distribution of the 93 sources with
f2-10 > 5 × 10-15 erg
cm-2 s-1 in the central regions of the CDFS, CDFN,
Lockman Hole
(Mainieri et al. 2002a),
Lynx field
(Stern et al. 2002)
and SSA13 field
(Mushotzky et al. 2000).
The spectroscopic
completeness of this combined sample is ~ 80%. Sources belonging
to the large scale structures observed in the CDFS and CDFN have been
excluded. The redshift distribution predicted by model B of GSH01 at
the same limiting flux and normalized to 116 objects (93/116 = 80%)
is also shown in Fig. 4 (left). An excess of
sources at z < 1 with respect to
the model predictions is still found in this clean sample.
 |
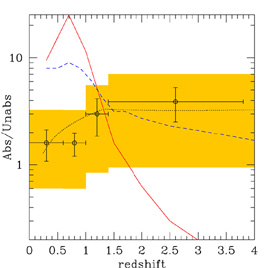 |
Figure 4. Left: Redshift
distribution for the 93 X-ray sources with
f2-10 > 5 × 10-15 erg
cm-2 s-1 in the central regions of the CDFS,
CDFN, Lockman Hole, Lynx field, and SSA13 field (see text; only
spectroscopic redshifts are considered). With this selection the
achieved spectroscopic completeness is ~ 80%. Sources belonging
to large scale structures in the CDFS and CDFN are excluded. The data
(shaded area) are compared with the predictions of model B by GSH01 at
the same limiting flux (dotted line), normalized to 116 sources
(93/116 = 80%). A clear excess of sources is observed at z <
1 with
respect to the model predictions.
Right: Ratio between AGN
with logNH > 22 and logNH <
22 as a function of redshift for the sources with
f2-10 > 5 × 10-16 erg
cm-2 s-1 detected in the inner
regions of the CDFS and CDFN (the spectroscopic completeness of this
sample is ~ 60%). Redshift bins have been chosen to contain
approximately the same number of sources. The predictions for the
Franceschini et al. (2002)
model and the
Gandhi & Fabian (2002)
model at comparable fluxes (f2-10 = 8 ×
10-16 and
5 × 10-16 erg cm-2 s-1 ,
respectively) are also plotted as a solid and dashed line,
respectively. The shaded area shows the possible range covered by the
data under the two extreme assumptions that the unidentified sources
(40% of the sample) are either all obscured or all unobscured (see
text). Both models seem to predict too many obscured AGN at z
< 1. For comparison the prediction by model B of GSH01 at
f2-10 > 5 × 10-16 erg
cm-2 s-1 is plotted as a dotted line. |
5. DO OBSCURED AGN EVOLVE LIKE STARBURST GALAXIES?
A solution to this discrepancy has been recently proposed by
Franceschini, Braito & Fadda (2002),
who suggested that obscured AGN
undergo a very fast evolution up to z = 0.8. The physical scenario
supporting this idea is that obscured AGN are related to the fast
evolving starburst population necessary to reproduce the ISO
mid-infrared counts
(Franceschini et al. 2001).
By shifting most of
the obscured AGN at z < 1, that model nicely reproduces the
redshift
distribution observed in the deep surveys; unobscured sources are
however still needed to explain the high redshift tail of the
distribution (see Fig. 5 in
Franceschini et al. 2002).
A more refined model has been recently worked out by
Gandhi & Fabian (2002),
who also make a connection between obscured AGN with the infrared
starburst population. Even this model is able to reproduce the low-z
peak in the redshift distribution, with the main contribution at
z < 1
provided by obscured AGN. Both these new models are bound to predict a
decrease with redshift in the ratio between obscured and unobscured
AGN, which can be checked on the CDFN and CDFS data. In
Fig. 4 (right)
it is shown the ratio between the number of sources with
logNH > 22
and logNH < 22 in the CDFS and CDFN as a function
of redshift. Only sources with
f2-10 > 5 × 10-16 erg
cm-2 s-1 and in the inner regions of
the two fields have been considered
1, to get a spectroscopic
completeness of ~ 60%. The combined sample contains 194 sources with
measured redshift, 85 from the CDFS and 109 from the CDFN. As in
Fig. 2, the
absorption column density for the CDFS sources has been calculated by
fitting the X-ray spectra with a simple absorbed power-law, fixing the
slope to = 1.8 when
the photon statistics is low. About 64% of
the considered CDFS sources have absorption in excess of
1022 cm-2 . The absorption column density for the
CDFN sources has been taken from Fig. 18 of
Barger et al. (2002),
who derived the NH
values from the source hardness ratios (fixing the photon index to
= 1.8). While the
redshifts considered in the CDFS subsample
are all spectroscopic, one third of the redshifts in the CDFN
subsample are photometric. Similarly to what found in the CDFS, 72%
of the considered CDFN sources have
NH > 1022 cm-2 . The shaded area
in Fig. 4 (right) shows the
possible range covered by the ratio
between the number of sources with column density above and below
1022 cm-2 under the two extreme assumptions that
the unidentified
sources are either all obscured or all unobscured. Although the
incompleteness is likely to increase with redshift, it is assumed to
be 40% in each redshift bin. The ratio predicted by the
Franceschini et al. (2002)
model, calculated at a comparable limiting
flux is also shown as a solid line. At low redshifts the predicted
ratio highly overestimates the data, while the opposite is true at
high redshifts. It is noted that the Franceschini et al. model is a
simple approximation, since only one class of obscured sources is
considered (with NH ~ 2 × 10²³
cm-2 ). In the more refined model
by Gandhi & Fabian (2002),
where several classes of sources with
different obscuration are assumed, the discrepancy is less
significant, but still the ratio between AGN with
logNH > 22 and
logNH < 22 is overestimated at z < 1.
Fig. 4 (right) indicates that at
z < 1 the ratio between AGN with
logNH > 22 and logNH < 22 is
lower than ~ 3, suggesting that
the low-z peak in the redshift distribution is not due exclusively to
obscured sources. Since the XLF of unobscured AGN is not properly
sampled by ROSAT at low luminosities and moderate redshifts
(1042erg s-1 at z ~ 1), a regime now
accessible to Chandra, the
assumed extrapolations might not be correct (preliminary results
suggest this is indeed the case; see
Cowie et al. 2003 and
Hasinger et al. 2003)
and a new determination of the AGN XLF is therefore needed.
1 About 1/4 of the CDFN
sample is actually selected at fluxes above
5 × 10-15 erg cm-2 s-1 (see
Barger et al. 2002).
Back.
6. CONCLUSIONS
The deep surveys have finally established that the cosmic X-ray
background in the 2-10 keV band is produced by the integrated emission
of obscured and unobscured AGN, confirming to the first order the main
prediction of population synthesis models. Now it is possible to put
tighter constraints to the model parameter space and study in detail
the AGN evolution down to luminosities of 1042erg
s-1 at z ~ 1,
checking if previous assumptions were correct. The AGN redshift
distribution observed in the deep surveys seems to peak at z < 1,
while standard synthesis models were expecting a peak at
z = 1.3 - 1.5. Assuming that obscured AGN evolve very quickly up to
z < 1 does solve the discrepancy in the redshift distribution but
predicts too many obscured AGN among low-z sources. A new
determination of the XLF of unobscured AGN in the regime not covered
by previous shallower surveys is therefore needed, which has then to
be implemented into the XRB synthesis models.
ACKNOWLEDGMENTS
I gratefully acknowledge all the members of the Chandra Deep Field
South collaboration.
REFERENCES
Akiyama, M. et al.,
Optical Identification of the ASCA Large Sky Survey,
Astrophys. J., 532, 700-727, 2000.
Alexander, D.M. et al.,
Resolving the Source Populations that Contribute to the X-ray
Background: The 2 Ms Chandra Deep Field-North Survey,
Astron. Nach., in press, 2002
[astro-ph/0210308].
Barger, A.J. et al., X-Ray,
Optical, and Infrared Imaging and Spectral Properties of the 1 Ms
Chandra Deep Field North Sources,
Astron. J., 124, 1839-1885, 2002.
Brandt, N.W. et al.,
The Chandra Deep Field North Survey. V. 1 Ms Source Catalogs,
Astron. J., 122, 2810-2832, 2001.
Cagnoni, I. et al.,
A Medium Survey of the Hard X-Ray Sky with the ASCA Gas Imaging
Spectrometer: The (2-10 keV) Number Counts Relationship,
Astrophys. J., 493, 54-61, 1998.
Comastri, A. et al.,
The contribution of AGNs to the X-ray background,
Astron. & Astrophys., 296, 1-12, 1995.
Comastri, A. et al.,
The BeppoSAX High Energy Large Area Survey (HELLAS) - III. Testing
synthesis models for the X-ray background,
Mon. Not. Roy. Ast. Soc., 327, 781-787, 2001.
Cowie, L. et al.,
The Redshift Evolution of the 2-8 keV X-Ray Luminosity Function,
Astrophys. J., 584, L57-60, 2003.
Fabian, A.C. et al.,
Do nuclear starbursts obscure the X-ray background?,
Mon. Not. Roy. Ast. Soc., 297, L11-15, 1998.
Fiore, F. et al.,
The BeppoSAX High Energy Large Area Survey (HELLAS) - II. Number counts
and X-ray spectral properties,
Mon. Not. Roy. Ast. Soc., 327, 771-780, 2001.
Franceschini, A. et al.,
A long-wavelength view on galaxy evolution from deep surveys by the
Infrared Space Observatory,
Astron. & Astrophys., 378, 1-29, 2001.
Franceschini, A., V. Braito, and D. Fadda,
Origin of the X-ray background and AGN unification: new perspectives,
Mon. Not. Roy. Ast. Soc., 335, L51-L56, 2002.
Gendreau, K.C. et al.,
ASCA Observations of the Spectrum of the X-Ray Background,
Pub. Ast. Soc. Jap., 47, L5-L9, 1995.
Georgantopoulos, I. et al.,
A deep ROSAT survey - V. The extragalactic populations at faint fluxes,
Mon. Not. Roy. Ast. Soc., 280, 276-284, 1996.
Gandhi, P., and A.C. Fabian,
X-ray background synthesis: the infrared connection,
Mon. Not. Roy. Ast. Soc., in press, 2002
[astro-ph/0211129].
Giacconi, R. et al.,
Chandra Deep Field South: The 1 Ms Catalog,
Astrophys. J. Suppl., 139, 369-410, 2002.
Gilli, R., G. Risaliti, and M. Salvati,
Beyond the standard model for the cosmic X-ray background,
Astron. & Astrophys., 347, 424-433, 1999.
Gilli, R., M. Salvati, and G. Hasinger,
Testing current synthesis models of the X-ray background,
Astron. & Astrophys., 366, 407-417, 2001.
Gilli, R. et al.,
Tracing the large scale structure in the CDFS,
Astrophys. J., submitted, 2003.
Gruber, D.E., The Hard X-Ray Background, in
The X-ray background,
eds. X. Barcons and A.C. Fabian, pp. 44-53, Cambridge Univ. Press,
Cambridge, 1992.
Gruber, D.E. et al.,
The Spectrum of Diffuse Cosmic Hard X-Rays Measured with HEAO 1,
Astrophys. J., 520, 124-129, 1999.
Hasinger, G. et al.,
XMM-Newton observation of the Lockman Hole. I. The X-ray data,
Astron. & Astrophys., 365, L45-L50, 2001.
Hasinger, G. et al.,
Understanding the sources of the X-ray background: VLT identifications
in the Chandra/XMM-Newton Deep Field South,
The Messenger, 108, 11-16, 2002.
Hasinger, G. et al.,
Formation and Evolution of Supermassive Black Holes in Galactic Centers:
Observational Constraints in
The Emergence of Cosmic Structure, eds. S.S. Holt and
C. Reynolds, 2003
[astro-ph/0302574].
Hornschemeier, A.E. et al.,
The Weak Outnumbering the Mighty: Normal Galaxies in Deep Chandra Surveys,
Astron. Nach., in press, 2002
[astro-ph/0211487].
Hornschemeier, A.E.,
The Challenge to Large Optical Telescopes
from X-ray Astronomy, in Science with 6-10 m Class Telescopes,
proc. SPIE, in press, 2002
[astro-ph/0210044].
Ishisaki, Y. et al.,
ASCA Deep Survey in the Lockman Hole Field,
Pub. Ast. Soc. Jap., 53, 445-457, 2001.
Kinzer, R.L. et al.,
Diffuse Cosmic Gamma Radiation Measured by HEAO 1,
Astrophys. J., 475, 361-372, 1997.
Kushino, A. et al.,
Study of the X-Ray Background Spectrum and Its Large-Scale Fluctuation
with ASCA,
Pub. Ast. Soc. Jap., 54, 327-352, 2002.
Lehmann, I. et al.,
The ROSAT Deep Survey. VI. X-ray sources and
Optical identifications of the Ultra Deep Survey,
Astron. & Astrophys., 371, 833-857, 2001.
Lumb, D.H. et al.,
X-ray background measurements with XMM-Newton EPIC,
Astron. & Astrophys., 389, 93-105,
2002.
Madau, P., G. Ghisellini, and A.C. Fabian,
The Unified Seyfert Scheme and the Origin of the Cosmic X-Ray Background,
Mon. Not. Roy. Ast. Soc., 267, L17-L21, 1994.
Mainieri, V. et al.,
XMM-Newton observation of the Lockman Hole. II. Spectral analysis,
Astron. & Astrophys., 393, 425-438, 2002a.
Mainieri, V. et al.,
XMM-Newton observations of the Lockman Hole: Spectral analysis, in
New Visions of the X-ray Universe in the XMM-Newton and Chandra
Era, eds. F. Jansen et al. 2002b
[astro-ph/0202211].
Maiolino, R., and G.H. Rieke,
Low-Luminosity and Obscured Seyfert Nuclei in Nearby Galaxies,
Astrophys. J., 454, 95-105, 1995.
Marshall, F.E. et al.,
The diffuse X-ray background spectrum from 3 to 50 keV,
Astrophys. J., 235, 4-10, 1980.
Miyaji, T., G. Hasinger, and M. Schmidt,
Soft X-ray AGN luminosity function from it ROSAT
surveys. I. Cosmological evolution and contribution to the soft X-ray
background,
Astron. & Astrophys., 353, 25-40, 2000.
Miyaji, T. et al.,
XMM-Newton View of the Hubble Deep Field-North and Groth-Westphal Strip
Regions,
Astron. Nach., in press, 2002
[astro-ph/0211343].
Miyaji, T., and R.E. Griffiths,
Faint-Source Counts from Off-Source Fluctuation Analysis on Chandra
Observations of the Hubble Deep Field-North,
Astrophys. J., 564, L5-L8, 2002.
Moretti, A. et al.,
The Brera Multiscale Wavelet Detection
Algorithm Applied to the Chandra Deep Field-South: Deeper and Deeper,
Astrophys. J., 570, 502-513, 2002.
Mushotzky, R.F. et al.,
Resolving the extragalactic hard X-ray background,
Nature, 404, 459-464, 2000.
Ogasaka, Y. et al.,
Sky surveys with ASCA -- Deep Sky Survey,
Astron. Nach., 319, 43-46, 1998.
Page, M.J. et al.,
X-ray and optical properties of X-ray sources
in the 13hr XMM-Newton/Chandra deep survey,
Astron. Nach., in press, 2002
[astro-ph/0212035].
Pompilio, F., F. La Franca, and G. Matt,
The X-ray background and the evolution of AGN,
Astron. & Astrophys., 353, 440-446, 2000.
Ptak, A. et al.,
The Consequences of the Cosmic Star Formation Rate: X-Ray Number Counts,
Astrophys. J., 559, L91-L95, 2001.
Ranalli, P., A. Comastri, and G. Setti,
The 2-10 keV luminosity as a Star Formation Rate indicator,
Astron. & Astrophys., 399, 39, 2002.
Risaliti, G., R. Maiolino, and M. Salvati,
The Distribution of Absorbing Column Densities among Seyfert 2 Galaxies,
Astrophys. J., 522, 157-164, 1999.
Rosati, P. et al.,
The Chandra Deep Field-South: The 1 Million Second Exposure,
Astrophys. J., 566, 667-674, 2002.
Setti, G., and L. Woltjer,
Active Galactic Nuclei and the spectrum of the X-ray background,
Astron. & Astrophys., 224, L21-L23, 1989.
Stern, D.E. et al., SPICES II: Optical and
Near-Infrared Identifications of Faint X-Ray Sources from Deep Chandra
Observations of Lynx,
Astron. J., 123, 2223-2245, 2002.
Tozzi, P. et al.,
Resolving the X-ray background with Chandra:
the 1 MS observation of the Chandra Deep Field South, in
Clusters of Galaxies and the High Redshift Universe
Observed in X-rays, eds. D. Neumann, F. Durret and J. Tran Thanh
Van, 2001a.
Tozzi, P. et al., New Results from the X-Ray and
Optical Survey of the Chandra Deep Field-South: The 300 Kilosecond
Exposure. II,
Astrophys. J., 562, 42-51, 2001b.
Ueda, Y., Results from X-ray Surveys with ASCA, in
X-ray astronomy : stellar endpoints, AGN, and the
diffuse X-ray background, eds. N.E. White, G. Malaguti and
G.G.C. Palumbo, pp. 396-405, 2001.
Vecchi, A. et al.,
The BeppoSAX 1-8 keV cosmic background spectrum
Astron. & Astrophys., 349, L73-L76,
1999.
Wilman, R.J., and A.C. Fabian,
Fitting the spectrum of the X-ray background: the effects of
high-metallicity absorption,
Mon. Not. Roy. Ast. Soc., 309, 862-870, 1999.
Warwick, R.S., and T.P. Roberts,
The extragalactic X-ray background at 0.25 keV,
Astron. Nach., 319, 59-62, 1998.
Wright, E.L. et al.,
Interpretation of the COBE FIRAS CMBR spectrum,
Astrophys. J., 420, 450-456, 1994.