


A number of deep (~ Ms) and moderately deep (~ 200 ks) X-ray surveys are being conducted in different sky fields with Chandra and XMM.
The Chandra Deep Field North (CDFN, Brandt et al. 2001) and the Chandra Deep Field South (CDFS, Giacconi et al. 2002; Rosati et al. 2002) have been observed with the ACIS-I array for 2 Ms and 1 Ms respectively, and represent the two deepest X-ray surveys to date. In the 2 Ms CDFN the achieved sensitivity limit is ~ 1.5 × 10⁻¹⁷ erg cm-2 s-1 in the soft band and ~ 1.0 × 10⁻¹⁶ erg cm-2 s-1 in the hard band (Alexander et al. 2002). In the CDFS the sensitivity limits of f0.5-2 ~ 5.5 × 10⁻¹⁷ erg cm-2 s-1 and f2-10 ~ 4.5 × 10⁻¹⁶ erg cm-2 s-1 obtained by Rosati et al. (2002) have been pushed to f0.5-2 ~ 2.4 × 10⁻¹⁷ erg cm-2 s-1 and f2-10 ~ 2.1 × 10⁻¹⁶ erg cm-2 s-1 by refining the detection techniques (Moretti et al. 2002). The Chandra ACIS-I observations of these fields have been complemented with deep XMM exposures: 180 ks and 370 ks of clean XMM data have been obtained for the CDFN (Miyaji et al. 2002) and the CDFS (Hasinger et al. 2002), respectively. The full source catalogs of the 1 Ms ACIS-I observations of the CDFN and CDFS have been already released (Brandt et al. 2001; Giacconi et al. 2002), while the additional 1 Ms ACIS-I observation of the CDFN and the XMM observations of the CDFN and CDFS are actually under analysis and only preliminary results are available (Alexander et al. 2002; Miyaji et al. 2002; Hasinger et al. 2002). Deep Chandra HRC and XMM exposures are on going in the Lockman Hole (see Hasinger et al. 2001 for the analysis of the first XMM data), where the deepest ROSAT and ASCA surveys were already performed (the ROSAT UDS, Lehmann et al. 2001, and the ASCA Deep Survey, Ishisaki et al. 2001). Other examples of combined Chandra/XMM deep surveys are being carried out in the Lynx field (Stern et al. 2002), in the Groth-Westphal strip (Miyaji et al. 2002) and in the 13hr field (Page et al. 2002). A summary of the main deep and moderately deep Chandra/XMM surveys is shown in Table 1.
| Survey | RA | DEC | X-ray data | f0.5-2 a | f2-10 b | Nc | Reference |
| (J2000) | |||||||
| CDFN | 189.200 | 62.231 | 2 Ms Chandra ACIS-I | 0.1 | 0.1 | 503 | 1 |
| 180 ks XMM | 4 | 2 | ~ 200 | 2 | |||
| CDFS | 53.116 | -27.808 | 1 Ms Chandra ACIS-I | 0.5 | 0.4 | 346 | 3,4 |
| 370 ks XMM | 5 | ||||||
| Lockman Hole | 163.179 | 57.480 | 300 ks Chandra HRC | ||||
| 100 ks XMM | 3.1 | 1.4 | ~ 200 | 6 | |||
| Lynx Field | 132.229 | 44.909 | 180 ks Chandra ACIS-I | 1.7 | 1.3 | 153 | 7 |
| 140 ks XMM | |||||||
| Groth Strip | 214.429 | 52.474 | 200 ks Chandra ACIS-I | ||||
| 80 ks XMM | 6 | 4 | ~ 150 | 2 | |||
| 13hr field | 203.654 | 37.912 | 120 ks Chandra ACIS-I | 214 | 8 | ||
| 130 ks XMM | 5 | ~ 3 | 216 | 8 | |||
a Limiting flux in the 0.5-2
keV band in units of
10-16 erg cm-2 s-1 .
|
|||||||
In the soft band, the deepest observations are detecting sources about two orders of magnitude fainter than those observed by the ROSAT UDS. The progress in the hard X-rays is even higher, since Chandra is now detecting sources ~ 300 times fainter than those detected in the ASCA Deep Survey.
As shown by
Tozzi et al. (2001a),
the integrated emission of all the
CDFS sources has already resolved the 2-10 keV background flux
measured by HEAO-1. Furthermore, the stacked spectrum of the whole
CDFS sample is well described by a powerlaw with
 = 1.4
(Tozzi et al. 2001a),
in excellent agreement with the measurements of the XRB
spectral slope in that energy range (see
Fig. 1).
= 1.4
(Tozzi et al. 2001a),
in excellent agreement with the measurements of the XRB
spectral slope in that energy range (see
Fig. 1).
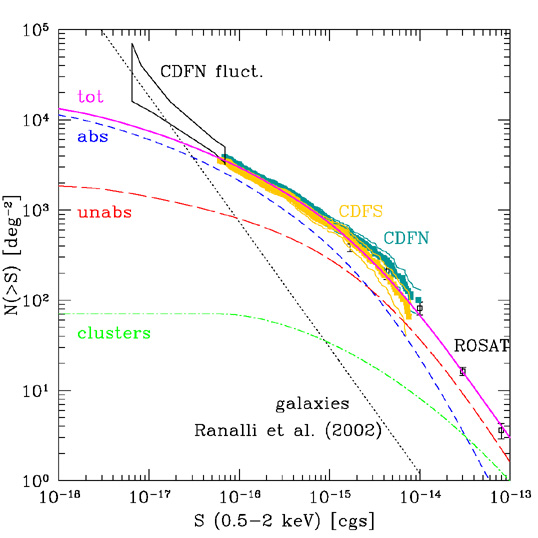
The soft and hard logN-logS calculated in the CDFS and CDFN are confirming the predictions by AGN synthesis models. As shown in Fig. 2, the logN-logS curve for model B of GSH01, which is the summed contribution of absorbed AGN, unabsorbed AGN and clusters of galaxies, can reproduce the CDFN and CDFS data at all fluxes. Some deviations are observed in the soft logN-logS when considering the data from the CDFN fluctuation analysis (Miyaji and Griffiths 2002), which are higher than the model expectations. However, as shown in Fig. 2 (up), at those faint fluxes a population of normal/starburst galaxies is expected to provide a major contribution (Ptak et al. 2001; Ranalli, Comastri & Setti 2002).
 |
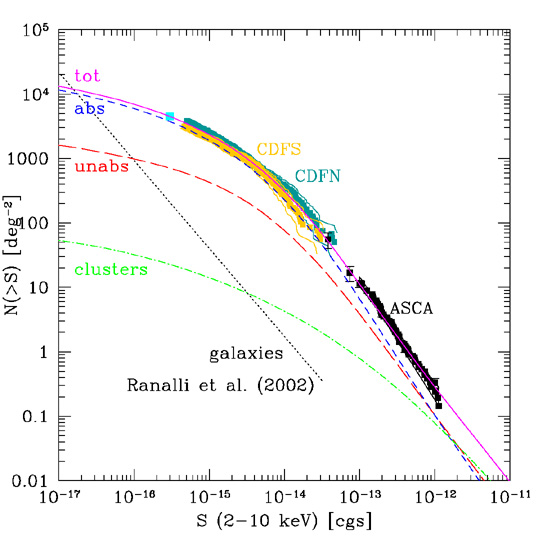 |
Figure 2. Soft (up) and hard (bottom) logN-logS compared with the predictions of model B by GSH01. Different curves correspond to the contribution of different classes of objects as labeled. The galaxy counts predicted by the Ranalli et al. (2002) model are also plotted as a dotted line. CDFS and CDFN data are from Rosati et al. (2002) and from Brandt et al. (2001). The CDFN fluctuation analysis box is adapted from Miyaji & Griffiths (2002). ROSAT data are from Miyaji et al. (2000). ASCA data (black squares) at f2-10 = 4 × 10-14, 7 × 10-14 and > 10-13 erg cm-2 s-1 are from Ogasaka et al. (1998), Ueda (2001) and Cagnoni et al. (1998), respectively. The deepest datapoint in the hard logN-logS is from Moretti et al. (2002). |