


4.1. The sources populating the Deep Surveys
Due to the extremely faint X-ray fluxes sampled by the deep surveys, for standard X-ray to optical flux ratios, 8-10 meter class telescopes are needed for the optical followup (see Hornschemeier 2002 for a review). Optical spectra of the X-ray sources in the CDFN are being obtained at Keck (Barger et al. 2002), while the VLT is primarily exploited for optical spectroscopy of CDFS sources (Szokoly et al. in preparation; see also Hasinger et al. 2002). The spectroscopic completeness in the CDFS and CDFN is roughly 40 - 50%, but it increases up to ~ 80% when considering the inner part of the fields and sources with X-ray fluxes well above the survey sensitivity limit. A direct redshift estimate is not possible for a significant fraction of X-ray sources even with 10m class telescopes: ~ 25% of the X-ray sources have counterparts fainter than R = 25, while ~ 15% do not have any counterpart down to R magnitudes of 26.1-26.7 (Giacconi et al. 2002). Nevertheless, photometric redshifts are being determined for optically faint sources. The counterparts of the X-ray sources reveal a broad variety of optical properties. Broad line and narrow line AGN are commonly found, but there are also sources with no obvious high-excitation emission lines in their spectra. When the optical classification is uncertain, the X-ray properties such as the X-ray luminosity and hardness ratio, in addition to the X-ray to optical flux ratio (fx / fopt), can be used to discriminate between nuclear and stellar activity (see e.g. Hasinger et al. 2002). As shown by Hornschemeier et al. (2002) and Giacconi et al. (2002), about 15 - 20% of the sources populating the deep X-ray surveys have fx / fopt values typical of normal/starbursts galaxies, with this fraction being higher in the soft band and towards faint fluxes. On the contrary, the contribution of non-active galaxies is negligible when selecting sources with 2-10 keV fluxes above a few × 10-15 erg cm-2 s-1 .
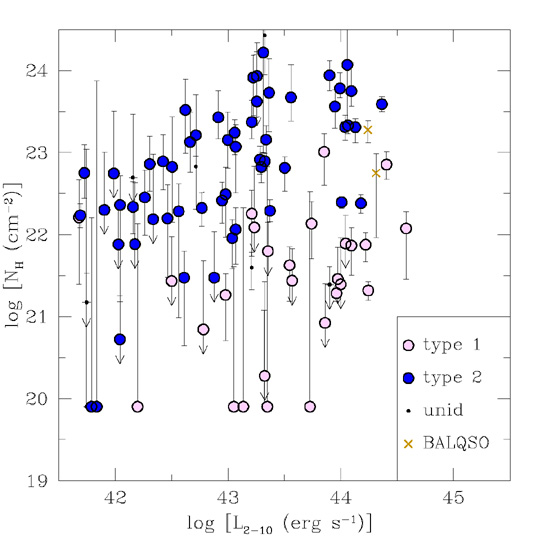
In Fig. 3 (top panel) the absorbing column of
CDFS sources, measured
from the X-ray spectral fit, is plotted against their rest frame,
intrinsic (i.e. de-absorbed) X-ray luminosity in the 2-10 keV band
(L2-10), calculated assuming H0 = 50
km s-1 Mpc-1 and
q0 = 0.5. When the photon statistics is low, the
spectral index is fixed to
 = 1.8 and the
absorbing column measured
accordingly. Different symbols correspond to different optical types
(only sources with
f2-10 > 5 × 10-16 erg
cm-2 s-1 and good
spectroscopic redshift are shown). A fraction of AGN with broad
optical lines are found to have X-ray absorption in excess of
1022cm-2 , confirming the optical to X-ray
classification mismatch already observed in shallower X-ray surveys
(e.g. HELLAS,
Fiore et al. 2001;
Comastri et al. 2001).
A number of sources are found to have
L2-10 > 1044erg s-1 and
NH > 1022cm-2 , which can be well
considered the faint tail of the QSO2 population (a similar result has
been found in the Lockman Hole by
Mainieri et al. 2002a).
Given the
relatively low space density of luminous sources, the high-luminosity
tail of the QSO2 population is best sampled by shallow, wide area
surveys.
= 1.8 and the
absorbing column measured
accordingly. Different symbols correspond to different optical types
(only sources with
f2-10 > 5 × 10-16 erg
cm-2 s-1 and good
spectroscopic redshift are shown). A fraction of AGN with broad
optical lines are found to have X-ray absorption in excess of
1022cm-2 , confirming the optical to X-ray
classification mismatch already observed in shallower X-ray surveys
(e.g. HELLAS,
Fiore et al. 2001;
Comastri et al. 2001).
A number of sources are found to have
L2-10 > 1044erg s-1 and
NH > 1022cm-2 , which can be well
considered the faint tail of the QSO2 population (a similar result has
been found in the Lockman Hole by
Mainieri et al. 2002a).
Given the
relatively low space density of luminous sources, the high-luminosity
tail of the QSO2 population is best sampled by shallow, wide area
surveys.
 |
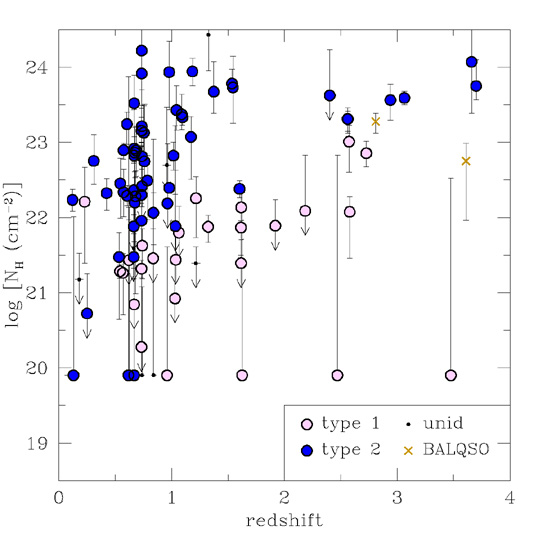 |
Figure 3. Top: rest-frame absorbing column density versus rest frame, intrinsic (de-absorbed) luminosity in the 2-10 keV band for the CDFS sources with f2-10 > 5 × 10-16 erg cm-2 s-1 (a cosmological model with H0 = 50 km s-1 Mpc-1 and q0 = 0.5 has been assumed). Different symbols represent different optical types as labeled. Type 1 AGN do show broad lines, while type 2 AGN do not (see Szokoly et al. in preparation for the detailed classification criteria). Sources with uncertain classification are plotted as dark dots. Obscured QSOs populate the upper-right corner of the plot (with L2-10 > 1044erg s-1 and NH > 1022cm-2 ). As already observed in shallower surveys (e.g. HELLAS, Fiore et al. 2001) several broad line AGN are found to have X-ray absorption in excess of 1022cm-2. Bottom: rest-frame absorbing column density versus redshift for the same source sample. Symbols are the same as in the top panel. |