


15.4.4. Redshift/Spectral-Index Diagrams
A plot of the integral number
N( , z |
S,
, z |
S,  )
d
d[log(z)] of sources per steradian
stronger than S at frequency
with spectral indices
to
+
d and redshifts
log(z)
to log(z) + d[log(z)] shows the correlation of
on z (or
L) for steep-spectrum sources
(Laing and Peacock 1980,
and references therein). Such a redshift/spectral-index diagram for
sources with S
)
d
d[log(z)] of sources per steradian
stronger than S at frequency
with spectral indices
to
+
d and redshifts
log(z)
to log(z) + d[log(z)] shows the correlation of
on z (or
L) for steep-spectrum sources
(Laing and Peacock 1980,
and references therein). Such a redshift/spectral-index diagram for
sources with S  2 Jy
at = 1.4 GHz is plotted in
Figure 15.8.
2 Jy
at = 1.4 GHz is plotted in
Figure 15.8.
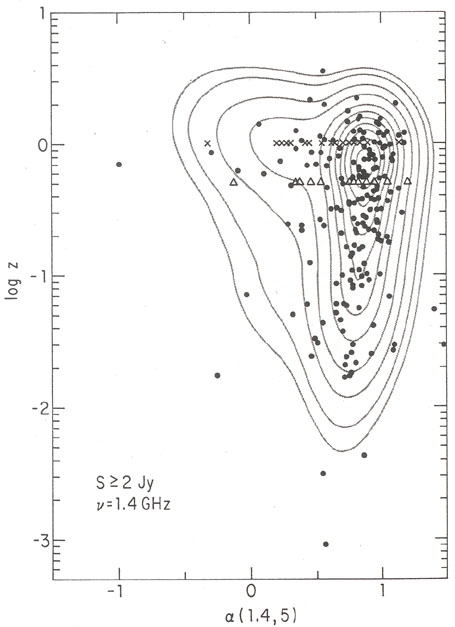 |
Figure 15.8. Redshift/spectral-index
diagram for a sample of 202
sources in 3.86 sr stronger than S = 2 Jy
at |
 1, and empty
fields by triangles at
z
1, and empty
fields by triangles at
z