


15.4.3. Spectral-Index Distributions
Two-point spectral indices
 (
( 1,
2) have been measured
between 1
1,
2) have been measured
between 1
 1.4 GHz and
2
5 GHz for a number of
flux-limited source samples. The integral number
N(| S,
)
d of sources per
steradian with spectral
indices to
+
d and flux
densities
1.4 GHz and
2
5 GHz for a number of
flux-limited source samples. The integral number
N(| S,
)
d of sources per
steradian with spectral
indices to
+
d and flux
densities  S at
frequency is shown for
S 0.8 Jy at
= 5 GHz in
Figure 15.7(a).
This (unnormalized) spectral-index distribution consists of a narrow
steep-spectrum component with
<>
0.7 and a
broader flat-spectrum component centered on
<>0.0. As the
sample selection frequency
is lowered, the number of
steep-spectrum sources increases rapidly and the median spectral indices
<> of both
components increase. The increase in
<> of each
spectral component is proportional to the square of its width
(Kellermann 1964),
so the median spectral index of
the flat-spectrum component changes more rapidly with frequency. These
effects can be seen by comparing Figure 15.7(a)
with the spectral-index distribution of
sources stronger than S = 2 Jy at
= 1.4 GHz
[Figure 15.7(b)]. The fraction of
flat-spectrum sources may also change with the sample flux-density limit
S at a
given frequency .
Figure 15.7(c) gives the spectral-index
distribution of fainter
(S 0.035 Jy) sources
selected at = 4.8 GHz.
S at
frequency is shown for
S 0.8 Jy at
= 5 GHz in
Figure 15.7(a).
This (unnormalized) spectral-index distribution consists of a narrow
steep-spectrum component with
<>
0.7 and a
broader flat-spectrum component centered on
<>0.0. As the
sample selection frequency
is lowered, the number of
steep-spectrum sources increases rapidly and the median spectral indices
<> of both
components increase. The increase in
<> of each
spectral component is proportional to the square of its width
(Kellermann 1964),
so the median spectral index of
the flat-spectrum component changes more rapidly with frequency. These
effects can be seen by comparing Figure 15.7(a)
with the spectral-index distribution of
sources stronger than S = 2 Jy at
= 1.4 GHz
[Figure 15.7(b)]. The fraction of
flat-spectrum sources may also change with the sample flux-density limit
S at a
given frequency .
Figure 15.7(c) gives the spectral-index
distribution of fainter
(S 0.035 Jy) sources
selected at = 4.8 GHz.
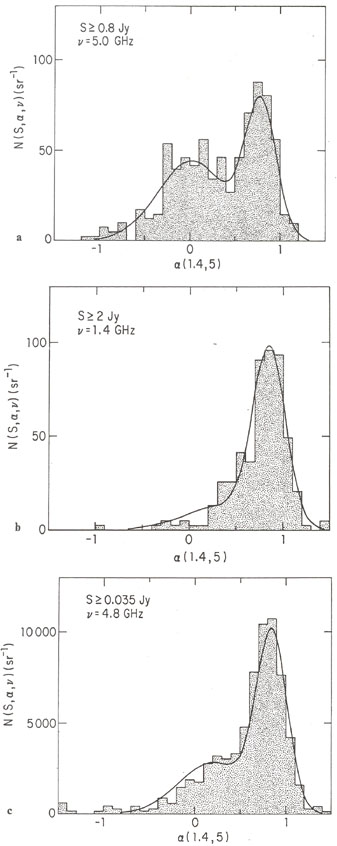 |
Figure 15.7. (a) Spectral-index
distribution of 320 sources stranger than S = 0.8 Jy at
|