


4.1. The Radio-Infrared Connection
The only class of AGN for which the IR and radio emission appear to be directly related is the CDRLQs. The smooth extrapolation of their SEDs between the two regions supports the generally accepted scenario (Barthel, these proceedings) that they are dominated by non-thermal, synchrotron emission. This emission is beamed towards us and its intensity is relativistically boosted and so dominates the radio-near-IR emission. We note however that, even in these objects, dust emission can be significant in parts of the SED (eg. in 3C273 ~ 3 µm, Courvoisier 1998).
One remaining puzzle in this apparently clear picture is that the non-thermal emission in RLQs has a very similar strength and shape to the IR emission from other AGN (Sanders et al. 1989, EWM94). The SED comparisons which have demonstrated this similarity of AGN SEDs across radio class have not distinguished between CDRLQs and LDRLQs, combining both types in generating the RLQ SED. However, unlike LDRLQs, CDRLQs possess many blazar-like qualities such as high polarisation and rapid coordinated variability, but also have a BBB and strong emission lines. Wills et al. (1992) concluded on the basis of polarisation studies, that CDRLQs are essentially the same as highly polarised quasars (HPQs). The SEDs of blazars, the rather heteregeneous class of objects including BL Lac objects, HPQs and optically violently variable sources (OVVs), are demonstrably different, primarily due to the lack of any BBB (Sanders et al. 1989, Impey & Neugebauer 1988). Their generally smooth SEDs and the higher incidence of detected variability in the IR has definitively established them as non-thermal sources (Impey & Neugebauer 1988). LDRLQs and RQQs, on the other hand, both show strong, broad and generally non-variable IR continua (Cutri et al. 1985, Edelson & Malkan 1987) with a steep cut-off in the FIR which does not extrapolate into the radio (Section 3.1.). This argues against the same, non-thermal emission component being responsible for both radio and IR emission. Initial ISO studies (Haas et al. 1998) suggest that CDRLQs are indeed non-thermal sources with blazar-like SEDs while LDRLQs have contributions from both thermal and non-thermal components. However this sample is small (10 objects) and a definitive solution to this puzzle awaits a systematic comparison of the SEDs of CDRLQs and "normal" AGN and/or LDRLQs.
There is a well-established, strong, ~ linear relation between radio and IR emission in normal and starburst galaxies (Mas-Hesse 1992 and references therein) which is generally interpreted as a combination of thermal emission from dust heated by star formation and non-thermal emission from supernova remnants. Radio studies of Seyfert 1 galaxies and RQQs, while showing extended structure reminiscent of star formation, also show central structures very similar to, but with lower luminosity than those in RLQs (e.g. De Bruyn & Wilson 1976, Ulvestad & Wilson 1984, Kukula et al. 1995, 1998, Blundell & Beasley 1998). This emission is too strong to be accounted for by normal star-formation rates (Ulvestad 1982) although these objects do fall on an extrapolation of the FIR-radio correlation (Kukula et al. 1998). This dichotomy can be explained by the large amount of scatter in the relation, which can hide and may be caused by significant contributions from unresolved, AGN-related emission. In addition, Kukula et al. (1998) argue that a correlation between the radio and optical AGN continuum would result in a AGN staying on the FIR-radio relation as the optical continuum heats the dust which emits the IR continuum. Note though that the existence of such a radio vs. optical relation is not clear (Lonsdale, Smith & Lonsdale 1995, Giuliano, Dario & Mezzetti 1996). Thus we conclude that the placement of AGN on the radio-IR relation does not prove that they are powered exclusively by a starburts.
4.2. The Infrared Emission: Thermal or Non-thermal
The typical steepness of the FIR cut-off,
 fir ~ 3.75 ±
0.48
(Hughes et al.
1993)
in RQQs, provides a convincing argument
for thermal emission from cool dust to dominate the FIR SEDs.
Non-thermal, synchrotron emission, even from
a single, homogeneous component, cannot produce a slope,
fir > 2.5 and
more typical values from known synchrotron sources is
fir
fir ~ 3.75 ±
0.48
(Hughes et al.
1993)
in RQQs, provides a convincing argument
for thermal emission from cool dust to dominate the FIR SEDs.
Non-thermal, synchrotron emission, even from
a single, homogeneous component, cannot produce a slope,
fir > 2.5 and
more typical values from known synchrotron sources is
fir
 1
(Peacock & Wall 1982,
Gear et al. 1994).
Dust, on the other
hand, can produce slopes as steep as 2-4, depending on the emissivity
law adopted
(Hughes et al.
1993).
1
(Peacock & Wall 1982,
Gear et al. 1994).
Dust, on the other
hand, can produce slopes as steep as 2-4, depending on the emissivity
law adopted
(Hughes et al.
1993).
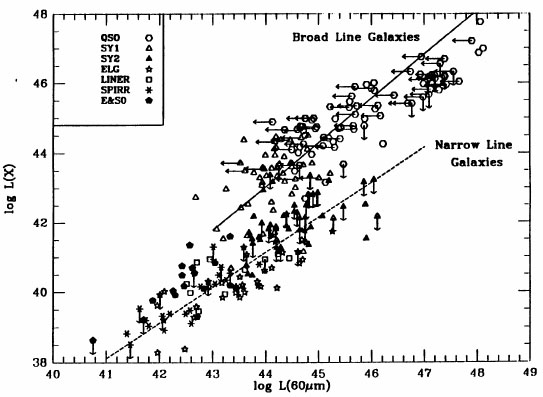
The first strong evidence for cool dust emission at long wavelengths coincided with reports of host dust in Fairall 9 deduced from an observed delay between the optical and near-IR light curves of 400 ± 100 days (Clavel, Wamsteker & Glass 1989). Detailed modelling of the dust reverberation deduces that the clouds are ~ 0.3 - 1.3 light years from the central source with dust sublimation temperatures 1300-2000K (Barvainis 1992). In addition the first large compilations of AGN SEDs (Kriss 1988, Sanders et al. 1989) demonstrated the ~ universal presence of an inflection at ~ 1 µm. In a dust scenario, the corresponding decrease in the NIR emission coincides with the sublimation temperature. This mounting evidence for thermal dust emission led to the development of pure dust models to explain the IR continuum of AGN (eg. Sanders et al. 1989, Lawrence et al. 1991, Barvainis 1990, Pier & Krolik 1993, Rowan-Robinson 1995). These models generally include some combination of cool dust from the host galaxy, warm dust in star formation regions and hot dust, for example in a dusty torus, heated by the central ionising continuum. The remaining emission at 1 µm is assumed to originate in starlight from the host galaxy and perhaps a nuclear starburst in the higher luminosity objects (Lawrence et al. 1991). Problems with these models include: the lack of observed silicate features in the NIR spectra of AGN which results in the need to minimize their strength in models (Roche et al. 1984), the fine tuning required to explain the strong IR-X-ray correlation (Carleton et al. 1987, Brissenden 1989, Figure 7 from Green, Anderson & Ward 1992), and the similarity of the IR continua in RLQs and RQQs which, in this scenario, originate in different mechanisms. Although we noted above (Section 4.1.) that this SED similarity may be the result of the inadequate samples studied to date.
|
Figure 7. The IR vs X-ray luminosities of narrow and broad lined AGN (from Green, Anderson & Ward 1992, their Figure 2) showing the similar but shifted relation for the two types. This is interpreted as due to the increased importance of non-thermal IR emission in the broad-lined objects. |
The alternative of non-thermal, synchrotron emission in the IR is also discussed by many authors. The general lack of IR variability (Cutri et al. 1985, Edelson & Malkan 1987) and polarisation results in no direct evidence for the presence of non-thermal emission. It is also clear from the "bumpy" shape of the IR SED that dust is an important contributor. However the IR-X-ray correlation (Figure 7), the need for an underlying power law in accretion disk (AD) models for the BBB (Section 4.3., Siemiginowska et al. 1995, Laor 1990) and the presence of emission in excess of the host galaxy in AGN with no BBB (McDowell et al. 1989, Puchnarewicz et al. 1995) all argue in favor of a non-thermal component. While the steep FIR cutoffs observed in IR-bright RQQs clearly demonstrate the presence of cool dust, there remain similar observations which are inconclusive (Chini, Kreysa & Wargau 1997) and many types of RQQ which have not yet been observed. Recent results from long-term (~ 25 years) NIR monitoring of a subset of the optically-selected, PG quasars provide evidence for a level of variability similar to that reported in the optical plus correlated variations from 1-10 µm in at least one object. Both results are best explained in terms of non-thermal emission (Neugebauer 1996).
In conclusion, the interplay of non-thermal and thermal emission in the IR SEDs of AGN remains unclear. It is likely that both contribute to varying degrees and their relative dominance may be a systematic function of other properties such as the radio emission.
4.3. The Optical/Ultra-Violet Big Blue Bump
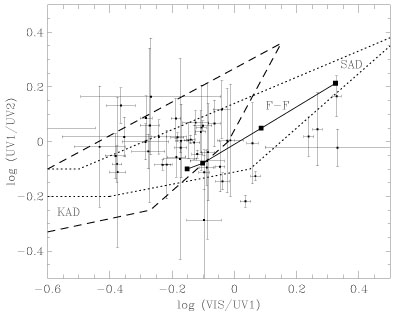
The origin of the BBB in AGN has been the subject of some debate in the literature over the past decade or so. Thermal emission from an optically thick, geometrically thin accretion disk (AD) is favored by many. Observationally, when combined with an underlying power law which contributes significantly at long wavelengths (5000 Å- 1 µm), it can re-produce the range of shapes observed for the OUV BBB (Figure 8, Siemiginowska et al. 1995). When combined with a corona, it is able to explain the ultra-soft X-ray excess as well (Czerny & Elvis 1987, Sun & Malkan 1989, Laor 1990, Siemiginowska et al. 1995). Theoretically, since AGN are generally believed to be powered by a central massive black hole, an AD is very likely to be present in an AGN core and to be a substantial contributor to its energy output. However problems with this model occur when detailed predictions are compared with the observations. In particular, AD models generally predict that the emission is polarised and has Lyman edge absorption due to the large optical depths. Neither of these properties is universally present in AGN SEDs and there is an on-going debate concerning the importance of these discrepancies (Koratkar et al. 1995, Koratkar, Kinney & Bohlin 1992, Blaes & Agol 1996, Antonucci et al. 1996, Shields, Wobus & Husfeld 1998, Agol, Blaes & Ionescu-Zanetti 1998).
|
Figure 8. Color-color diagram of quasar SEDs compared with the locus of values predicted by both Kerr (KAD) and Schwarzschild (SAD) accretion disk models for the OUV BBB (from Siemiginowska et al. 1995, their Figure 7). |
The main alternative model for the BBB is free-free emission (Barvainis 1993). This model can produce an OUV continuum with roughly the correct shape, but it is unable to explain the observed range of slopes (Siemiginowska et al. 1995). It is also inconsistent with the lack of observed, strong X-ray emission lines (Kriss 1994, Collin-Souffrin et al. 1996).
In conclusion, despite the continuing debate, the AD plus corona model remains the most viable model for the OUV-soft-X-ray BBB in AGN SEDs.
The primary X-ray source in RQQs is responsible for generating emission
with a power law slope,
x ~ 1 throughout
most of the X-ray region (~ 1 - > 200 keV).
The biggest problem faced by current models for the X-ray emission from
AGN, is the origin of this primary emission.
A non-thermal model with dominant pair production is ruled out in
current data as it predicts a steepening of the spectrum at energies
 10 keV, contrary to
the observations which typically show extensions out to > 100 keV
(Gondek et al.
1996,
Zdziarski et al.
1994).
The simplest, non-thermal models include a power-law distribution of
electrons which Thomson scatter off soft seed photons. These models
match the observed spectral slope but do not produce the observed ~ 200
keV, high-energy cut-off
(Gondek et al.
1996).
Currently the best models include repeated Compton scattering,
either combined with a non-thermal plasma having power law electron
distribution or thermal Comptonisation of soft seed photons
(Gondek et al.
1996,
Zdziarski et al.
1996).
The geometry of the source is not well-determined,
a leading contender is the two-phase model of Haardt & Maraschi
(1993,
1991)
in which the X-rays are produced via inverse Compton scattering in a hot
corona surrounding a cooler AD which is the main source of the UV seed
photons. This model is successful in producing the average Sy1
spectrum including the high-energy roll-over and can produce somewhat
steeper slopes, but is unable to produce the flatter slopes which have
been observed in a few Sy1 galaxies (e.g. NGC 4151,
Yaqoob, et al.
1993).
A more recent update of this model involves blobs rather than a smooth
corona and solves some of these problems
(Haardt, Maraschi &
Ghisellini 1994).
10 keV, contrary to
the observations which typically show extensions out to > 100 keV
(Gondek et al.
1996,
Zdziarski et al.
1994).
The simplest, non-thermal models include a power-law distribution of
electrons which Thomson scatter off soft seed photons. These models
match the observed spectral slope but do not produce the observed ~ 200
keV, high-energy cut-off
(Gondek et al.
1996).
Currently the best models include repeated Compton scattering,
either combined with a non-thermal plasma having power law electron
distribution or thermal Comptonisation of soft seed photons
(Gondek et al.
1996,
Zdziarski et al.
1996).
The geometry of the source is not well-determined,
a leading contender is the two-phase model of Haardt & Maraschi
(1993,
1991)
in which the X-rays are produced via inverse Compton scattering in a hot
corona surrounding a cooler AD which is the main source of the UV seed
photons. This model is successful in producing the average Sy1
spectrum including the high-energy roll-over and can produce somewhat
steeper slopes, but is unable to produce the flatter slopes which have
been observed in a few Sy1 galaxies (e.g. NGC 4151,
Yaqoob, et al.
1993).
A more recent update of this model involves blobs rather than a smooth
corona and solves some of these problems
(Haardt, Maraschi &
Ghisellini 1994).
The flattening of the X-ray spectrum ~ 5-10 keV (Section 3.3.) is widely accepted to originate in Compton reflection of the primary X-ray continuum in cool (~ 104K), optically thick material at the surface of the AD (Guilbert & Rees 1988, Lightman & White 1988, Pounds et al. 1990, Nandra & Pounds 1994). Reflection from neutral and ionized material, probably located in the putative molecular torus and/or the AD, has now been observed in a large number of Sy1 galaxies (Fiore et al. 1992, Turner et al. 1997a, Reynolds 1997). This component dominates the X-ray spectrum up to ~ 300 keV (Lightman & White 1988) where the material becomes optically thick to Compton scattering. The observed strength of the reflection component varies from object to object and tends be larger in lower luminosity sources (Williams et al. 1992, Lawson & Turner 1997).
The mid-X-ray continuum tends to be stronger and flatter in RLQs
(Section 3.3). This is thought to be due to a
radio-linked, synchrotron self-Compton (SSC) component
(Zamorani et al.
1981,
Wilkes & Elvis 1987).
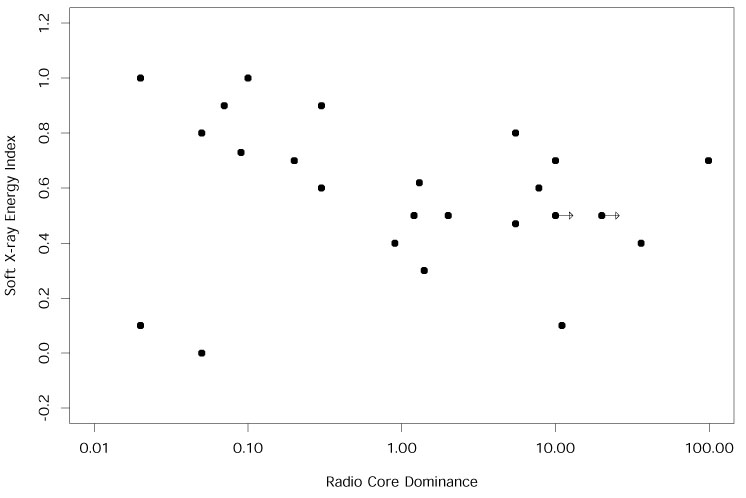
A strong correlation is present between X-ray slope and the
radio-core dominance (Figure 9), supporting
an interpretation in which the flatter,
x ~ 0.5,
SSC component is beamed
and so stronger and more dominant in core-dominated sources
(Shastri et
al.1993,
Lawson & Turner 1997).
|
Figure 9. Einstein soft X-ray slope
( |
4.5. X-ray Emission and Unification
In the context of Sy1/Sy2 unification, Sy2s are believed to be edge-on
Sy1 galaxies whose central regions are obscured by optically thick material,
perhaps in a torus
(Antonucci & Miller
1985).
The hard X-ray emission of the
two classes of source is expected to be similar since the column
densities are
sufficiently low that the hard X-rays are directly visible, even when
viewed edge-on. Recent X-ray studies of Sy2 galaxies with Ginga
(Smith & Done
1996) and ASCA
(Turner et al.
1997b,
Awaki 1997,
Awaki et al. 1997)
demonstrate that
the 1-10 keV (1-18 keV for Ginga) are indeed similar, including
contributions from a primary,
x ~ 1, power law,
a reflected
component and Fe K
emission. BeppoSAX and RXTE (Rossi X-ray
Timing Explorer) data, which extend to
higher energies, confirm that the hard X-ray
power law extends to
50 keV
(Wilkes et al.
1998,
Blanco 1998),
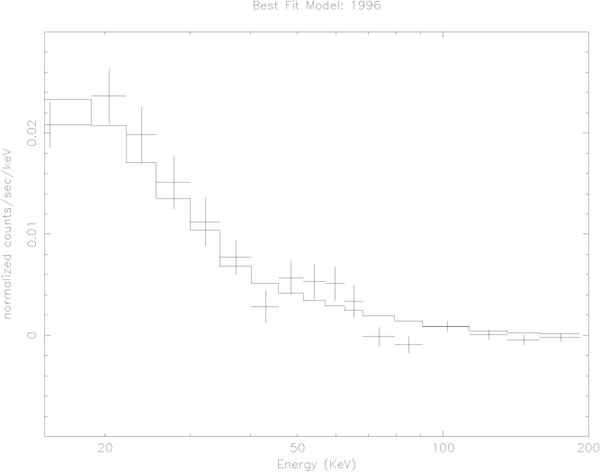
again consistent with Sy1 galaxies (Figure 10).
Thus the X-ray emission provides strong support for the unification of
Sy1/Sy2 galaxies.
|
Figure 10. Hard X-ray (PDS) SAX spectrum of the Seyfert 2 galaxy ESO103-G35 (from Wilkes et al. 1998, their Figure 2). |
Again consistent with unification
models, Sy2 galaxies generally show strong low-energy absorption
with column densities
1022
cm-2, compared with N
H ~ 1020 - 21 cm-2 for Seyfert 1
galaxies and quasars
(Section 3.3). These column densities
are generally consistent with absorption in the obscuring material
(Turner et al.
1997b,
Awaki 1997).
4.6. The relation between X-ray and Optical Emission
There is a well-established correlation between X-ray and optical emission in AGN such that higher luminosity sources have relatively weak X-ray emission (Worrall et al. 1987, Wilkes et al. 1994, Green et al. 1995, Green, these proceedings). Similar evidence is found when comparing low and high luminosity quasar SEDs (Wilkes et al. 1999). The relation as determined by Wilkes et al. (1994) is:
| < ox
> = (0.11 ± 0.02) (log Lopt - 30.5) + (1.53
± 0.02)
| (1) |
where ox is the
effective optical-to-X-ray slope and
Lopt the optical luminosity at 2500Å
(Tananbaum et al.
1979).
The existence and behavior of an
ox vs
Lopt relation has been disputed by a number of authors.
For example, ROSAT observations of high-redshift quasars
suggest that it holds for RQQs only
while for RLQs the relation flattens at high redshift
(Bechtold et al.
1994).
This conclusion was reached based on a comparison of ROSAT-observed,
high redshift quasars with data from
Wilkes et al.
(1994)
using the relation between
ox and
Lopt from the smaller sample of
Worrall et al.
(1987).
This relation is determined using a sample of < half
the size and is consistent with equation (1) but not so
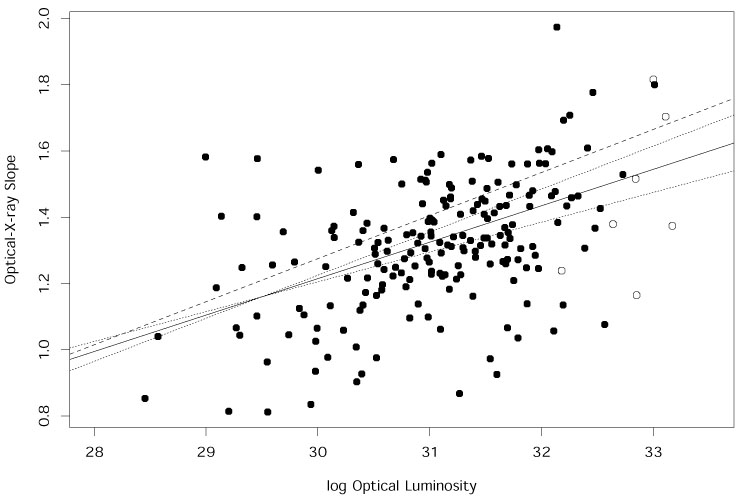
well-constrained. In Figure 11 the X-ray
detected RLQs from
Wilkes et al.
(1994)
are shown (filled circles) with those from Bechtold et al.
(1994,
open circles). The dashed line indicates the
Worrall et al.
(1987)
relation for steep-spectrum (SS) RLQs and suggests that
the high-redshift ROSAT objects have systematically strong X-ray fluxes.
However using the updated relation for RLQs determined from both
detections and
non-detections in the Einstein database, i.e.
replacing the constant of 1.53 in equation (1) with 1.27
(from Figure 14b of
Wilkes et al.
1994),
the RLQ discrepancy at high-redshift is less convincing (solid line in
Figure 11 with the
1 error range shown dotted). Observations of more,
high redshift quasars are needed to clarify any RLQ vs RQQ difference.
error range shown dotted). Observations of more,
high redshift quasars are needed to clarify any RLQ vs RQQ difference.
|
Figure 11.
|
La Franca et al. (1995) suggest that the relation is linear. This discrepancy may be due to their assumption that photometric errors dominate the dispersion in the relation whereas in reality the errors in Lopt are significantly smaller than the dispersion. Yuan, Siebert & Brinkmann (1998), on the other hand, suggest that the relation is an artifact caused by an intrinsic dispersion in Lopt which is ~ 5 times larger than that in LX. However there is no apriori reason why this should be the case and there is no (other) evidence for such a difference in the intrinsic dispersion of the optical and X-ray luminosities.
In an extension to the
ox vs
Lopt relation
Zheng & Malkan (1993)
present evidence for a color-luminosity relation
in AGN which is consistent with the BBB moving towards lower
energies as the luminosity increases.
This luminosity dependence of AGN SEDs can
explain the Baldwin Effect in terms of the reduced ionising flux
at high luminosity
(Zheng & Malkan
1993).
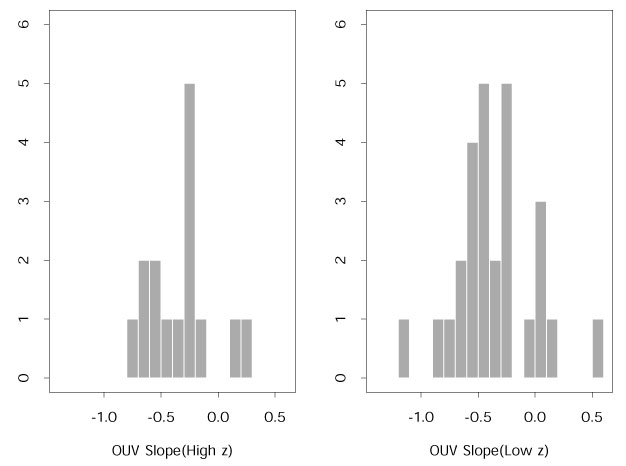
However, Kuhn (1996),
in her comparison of high and low redshift quasar SED matched in evolved
luminosity,
sees no such evolution of the BBB (Figure 12).
Kuhn (1996)
suggests that the reason for the discrepancy is the lack of allowance
for host galaxy emission in the
Zheng & Malkan (1993)
analysis. The weakening of the host galaxy contribution
systematically steepens the BBB as the luminosity increases causing the
observed increase in slope.
|
Figure 12. Comparison of the optical-UV slopes of high and low-redshift (z) samples of quasars matched in evolved luminosity (data taken from Kuhn 1996) demonstrating the lack of evolution in the continuum slope. This argues for a quasar population which is short-lived with multiple generations as opposed to a single-long-lived generation which would be expected to evolve as the central black hole accretes material. |
In summary, evidence to date supports the relative increase in
the strength of the BBB implied by the
ox vs
Lopt relation but not
a change in its shape. There is also no evidence for evolution of the
optical-X-ray SED with redshift
(Wilkes et al.
1994,
Elvis et al. 1994).
The luminosity dependence of the SED results in a decrease in the number
of ionising photons which is likely to be an important contributor to
the Baldwin effect, i.e. the constancy of the UV emission line fluxes
with increasing luminosity
(Mushotzky & Ferland
1984).
4.7. The Role of Dust in the OUV and X-ray
Over the past few years, evidence has been mounting which suggests that dust plays an important role in determining the wide dispersion in the SEDs of AGN. AGN are predominantly selected in optical surveys, commonly due to their UV excess in comparison with stars and galaxies (e.g. PG survey, Schmidt & Green 1983, LBQS survey, Hewett et al. 1995). This results in a strong bias towards optically-bright sources. Radio surveys are largely free from this bias and have resulted in the detection of unusually red AGN (Smith & Spinrad 1980, Webster et al. 1995). This led to the suggestion that many existing surveys are missing a substantial fraction of the population by selecting against red objects. X-ray surveys avoiding the soft X-ray band, which is strongly affected by absorption, should also be relatively unaffected by this bias. Evidence for a wider range of optical continuum slopes in the AGN population varies from sample to sample. The X-ray surveys: Cambridge-Cambridge ROSAT Serendipity Survey (CCRSS, Boyle, Wilkes & Elvis 1997) and ROSAT deep (Shanks et al. 1991) show a range of slopes very similar to optical samples (Boyle & di Matteo 1995) while the ROSAT International X-ray/Optical Survey (RIXOS) and Einstein Medium Sensitivy Survey (EMSS) samples show a wider range (Puchnarewicz et al. 1996, Stocke et al. 1991). Part of this discrepancy may be explained by differing amounts of host galaxy contamination in the various samples but it is intriguing to note that the CCRSS and RIXOS are selected using essentially the same X-ray energy range. Laor et al. (1997) in a study of a subset of the optically selected PG sample argue that the redder objects in the RIXOS sample would have been seen if present in the PG sample. The debate continues as evidence mounts for the existence of red AGN in radio and X-ray selected samples (e.g. Kim & Elvis 1998, Becker et al. 1997, Masci, Drinkwater & Webster 1999). It is likely that hard X-ray selected samples from AXAF and XMM, using a sufficiently hard energy range to be relatively unaffected by absorption for column densities typical of those seen in red AGN, will obtain AGN samples representative of the true parent population and so be able to address the question of the dispersion in their SEDs.
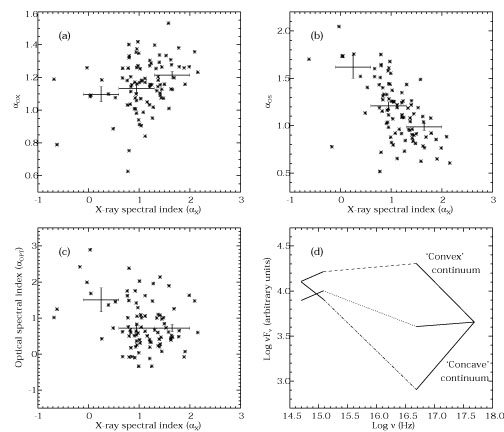
The RIXOS sample of 108 AGN
noted above is selected in the hard X-ray band of ROSAT
(0.4-2.0 keV) to minimise the affect of soft X-ray absorption.
Not only does this sample show a wide range in the OUV slope, but there
is also an intriguing set of correlations between the
optical and soft X-ray slopes
(Puchnarewicz et al.
1996).
These correlations show a reddening of the optical
continuum when the X-ray spectrum becomes harder
(Figure 13).
This implies that absorption
by dusty material is responsible for both and the authors suggest that the
wide range of optical continuum slopes is due to a range in the amount
of dust redenning.
In their much smaller (23 objects) subset of the optically selected PG
sample,
Laor et al. (1997)
also find a positive correlation of the X-ray slope with
ox which they
interpret as a decrease in the strength of the hard component.
|
Figure 13. The inter-dependence of the
optical and X-ray slopes in the X-ray selected RIXOS AGN sample.
The strong anti-correlations of
|
In RLQs, Baker (1997)
and Baker & Hunstead
(1995)
show a strong
correlation of the equivalent width (EW) of [OII]
 3727
with the radio core
dominance, R, which suggests a strong orientation dependence of the
optical continuum since [OII] is generally throught to be emitted
isotropically. [OIII]5007
has a weaker dependence on R (see
also Jackson & Browne
1991)
and the ratio of [OII] to [OIII]
depends on R. These correlations can be explained by an
orientation dependence of [OIII] which is similar to, but not as strong as,
that of the optical continuum, weakening the orientation dependence
of the EW for this line. Since the Balmer decrement is also observed to
be a strong function of R
(Baker 1997,
Jackson & Browne
1991),
these relations are interpreted
as due to an increasing column density of dust as the
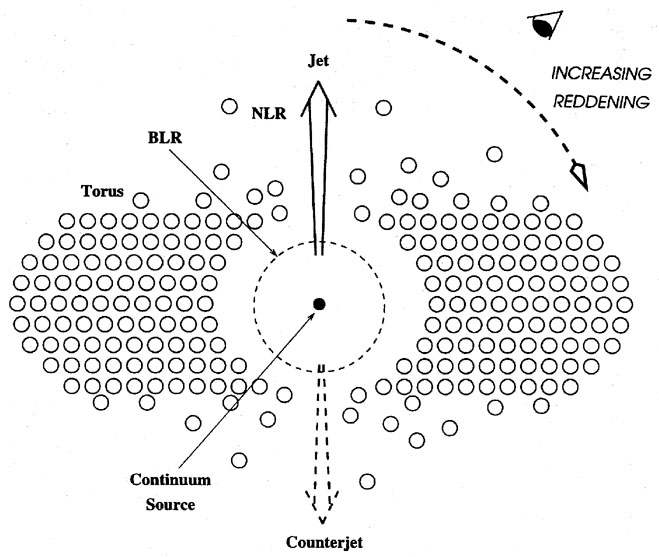
line-of-sight progresses from pole-on to edge-on in RLQs. The optical
continuum originates in the smallest region and so would be most affected
by the absorption while the [OII], largely emitted at greater distances
from the central source than the dust, would be the least affected
(Figure 14).
3727
with the radio core
dominance, R, which suggests a strong orientation dependence of the
optical continuum since [OII] is generally throught to be emitted
isotropically. [OIII]5007
has a weaker dependence on R (see
also Jackson & Browne
1991)
and the ratio of [OII] to [OIII]
depends on R. These correlations can be explained by an
orientation dependence of [OIII] which is similar to, but not as strong as,
that of the optical continuum, weakening the orientation dependence
of the EW for this line. Since the Balmer decrement is also observed to
be a strong function of R
(Baker 1997,
Jackson & Browne
1991),
these relations are interpreted
as due to an increasing column density of dust as the
line-of-sight progresses from pole-on to edge-on in RLQs. The optical
continuum originates in the smallest region and so would be most affected
by the absorption while the [OII], largely emitted at greater distances
from the central source than the dust, would be the least affected
(Figure 14).
|
Figure 14. Schemmatic diagram of the central regions of an AGN showing an increasing column density of dust as the plane of the central AD is approached (from Baker 1997, her Figure 19). |
4.8. Where do the NLSy1s fit in?
The properties of NLSy1 galaxies are discussed by a number of other authors
in these proceedings. As a reminder, their most notable properties
(Table 1)
are narrow (< 2000 km s-1) broad emission lines, strong
optical FeII emission, weak [OIII]
5007 and very steep soft
X-ray spectra.
The SED of a NLSy1 showing the typically strong, hot BBB and steep
soft X-ray slope is shown in Figure 15.
Their properties place them at the extreme end of the "first eigen
vector" of
Boroson & Green (1992)
which explains ~ 30% of the scatter in the line continuum correlation
of the PG sample
(Boroson & Green 1992,
Boller, Brandt & Fink
1996,
Lawrence et al.
1997).
Popular scenarios to explain this phenomenon include Eddington limited flow
(Pounds, Done and Osborne
1995,
Laor et al. 1997,
Laor these
proceedings) and/or a larger BLR, resulting in lower velocities and narrow
lines, due to the strong, steep soft X-ray continuum
(Wandel & Boller
1998,
Wandel these procedings).
|
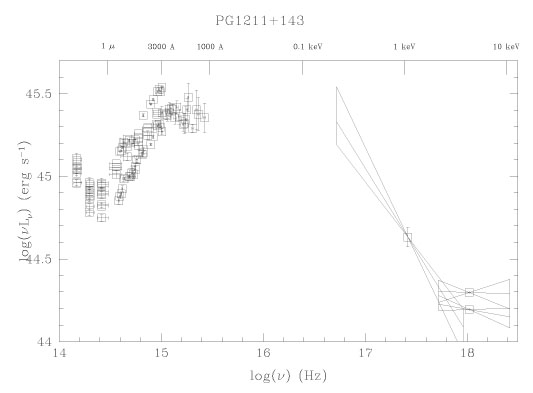
Figure 15. The rest-frame, near-IR-X-ray Spectral Energy Distribution (SED) of the NLSy1 galaxy PG1211+143 showing the unusually steep soft X-ray spectrum and a very pronounced OUV-soft-X-ray BBB which often characterises these sources (data from EWM94). |
Another scenario which has been suggested but largely discounted in the past (Boroson & Green 1992, Boroson 1992) is one of orientation. The main argument against this scenario is based on the strong presence of the [OIII] line in the correlations. [OIII] was, until recently, thought to be orientation independent implying that orientation cannot be an important factor in eigen vector one. However, in the light of recent evidence for the orientation dependence of [OIII] in RLQs (Section 4.7.), this argument weakens. Re-examination (below) of an orientation scenario suggests that it is at least as viable as those mentioned above and perhaps explains more of the observed properties.
It is well-established that RQQs have significantly stronger optical FeII
emission than RLQs
(Boroson & Green 1992,
Bergeron & Kunth
1984).
It is also generally accepted that
CDRLQs have stronger optical FeII emission than LDRLQs
(Shastri et al.
1993,
Joly 1991,
Boroson, Persson & Oke
1985,
Peterson, Foltz & Byard
1981)
although this has been disputed
(Jackson & Browne
1991,
Bergeron & Kunth
1984).
Based on a tendency for edge-on LDRLQs to have broader
H 4861 lines than face-on
CDRLQs,
Wills & Browne (1986)
argued that the broad line widths are correlated with the orientation of
the RLQs. Thus we see that the pole-on, CDRLQs have both narrower
broad lines and stronger optical FeII emission than LDRLQs.
If we draw an analogy between RLQs and RQQs, we find that NLSy1s are
those Sy1s with the narrowest broad lines and the
strongest optical FeII. For RQQs which, by definition, have no strong
radio emission, there is no accepted orientation
indicator with which to determine independently whether they are viewed
pole-on. However, assuming that
the H line behaves similarly
in RQQs and RLQs, we are led to the
conclusion that NLSy1s are the pole-on RQQs.
4861 lines than face-on
CDRLQs,
Wills & Browne (1986)
argued that the broad line widths are correlated with the orientation of
the RLQs. Thus we see that the pole-on, CDRLQs have both narrower
broad lines and stronger optical FeII emission than LDRLQs.
If we draw an analogy between RLQs and RQQs, we find that NLSy1s are
those Sy1s with the narrowest broad lines and the
strongest optical FeII. For RQQs which, by definition, have no strong
radio emission, there is no accepted orientation
indicator with which to determine independently whether they are viewed
pole-on. However, assuming that
the H line behaves similarly
in RQQs and RLQs, we are led to the
conclusion that NLSy1s are the pole-on RQQs.
| Parameter | NLSy1 | L~LEdd | Large RBLR | Pole-on |
| Orientation | ||||
| Reference | 1,2 | 3 | ||
| Optical FeII | Strong | X | X | 
|
| [OIII] | Weak | X | X |
|
| CIV,CIII] | Weak | X | X |
|
| FWHM(H)
| Narrow |
|
|
|
| x
| Steep |
|
|
|
| X-ray Vbly | Strong | X | X |
|
| LX(hard) | Weak |
|
|
|
| BBB | Strong |
|
|
|
| BBB | Hot |
|
| X |
| Reference:
1. Pounds, Done & Osborne 1995 2. Laor et al. 1997 3. Wandel & Boller 1998 | ||||
The successes and failures of the various scenarios for NLSy1s are shown
in Table 1.
An orientation scenario with NLSy1s analogous to CDRLQs would explain
the strong FeII and narrow H
properties as well as weak [OIII]
and [OII] following Baker's results (Section 4.7.).
Assuming an AD is the source of the ionising continuum, a pole-on AD
would also yield weaker and unobscured hard X-ray emission, a
stronger BBB and a stronger, hotter soft X-ray excess
(Netzer, Laor & Gondhalekar 1992
and references therein).
A clear view to the inner regions of the AD could also explain the larger
observed incidence of soft X-ray variability in these sources
since the inner regions have the smallest variability
timescales. The high densities in the BLR of NLSy1s deduced from the
weakness of
CIV1549 and
CIII]1909
(Kuraszkiewicz et
al. 1998,
Wilkes et al.
1999)
could also be explained in terms of a
clearer view to lower radii in the BLR. Orientation, while being the least
exciting of the scenarios in Table 1
since it lacks any direct connection to or means to constrain the central
engine, can explain more of the observed properties of NLSy1s than its
two main rivals. The only property which remains unexplained
is the relative weakness of the low temperature BBB emission which in
some cases results in no observable BBB in the OUV at all
(Puchnarewicz et al.
1995).