


The notable, standard features in quasar SEDs are labelled in Figure 1. Both radio-loud (RLQs) and radio-quiet quasars (RQQs) typically show bumps in the optical-UV and in the IR with an inflection point at ~ 1µm between the two. This inflection point, which represents a minimum in the energy output of the quasar, lines up with the peak in the starlight contribution from the host galaxy. In the lower luminosity, Seyfert galaxies the host galaxy contribution becomes comparable to the emission from the active nucleus, flattening the optical-IR SED and resulting in an apparent decrease in the strength of the optical and IR bumps. The dominance of the host galaxy emission ~ 1µm in these objects has been exploited to study their host galaxies (McLeod & Rieke 1994a, b, Taylor et al. 1996, Dunlop et al. 1993).
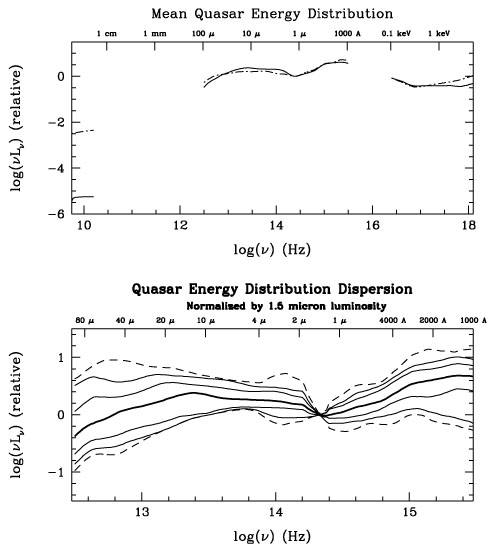
Figure 2 shows the median SED for RLQs (dashed) and RQQs (solid) from EWM94 showing the remarkable similarity in the IR-UV region. A similar figure was presented by Sanders et al. (1989) for the PG quasar sample. Although these medians look very similar and well-behaved, there is a large dispersion around the median which fills most/all of the available parameter space (Figure 2, lower plot). This dispersion exacerbates searches for systematic dependencies of the SEDs on other quasar properties (luminosity, Wilkes et al. 1999) and needs to be included in any interpretation and modelling of the SEDs.
|
Figure 2. The upper plot shows the mean radio-soft X-ray spectral energy distribution for radio-loud (dashed) and radio-quiet (solid) low-redshift quasars. The lower plot shows the 68, 90 and 100 (dashed) Kaplan-Meier percentile envelopes showing the large dispersion around the median in the near-IR-UV region (from EWM94, their Figure 11). |
The near-IR bump generally peaks ~ 25 - 60µm. It is broad, decreasing slowly to > 100µm, the longest wavelength accessible to IRAS. New observations by ISO should extend this coverage to 200 µm, but problems with the calibration have so far prevented reliable results. A recent paper from the ISOPHOT team which reports far-IR SEDs for 10 RLQs and RQQs suggests that this situation will soon improve (Haas et al. 1998).
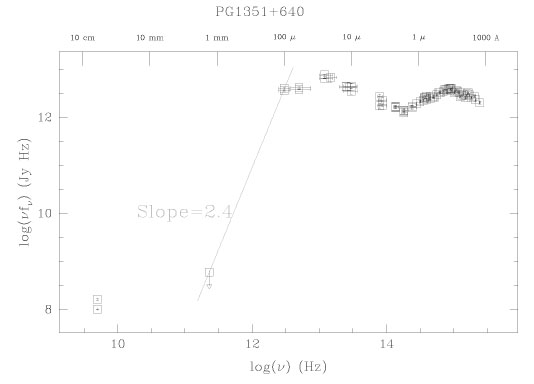
For RQQs, those objects with sub-mm or mm data are those which are brightest in the FIR and are mostly at low redshift. Typically very sharp cut-offs are seen between 100µm and 1 mm (Chini et al. 1989, Lawrence et al. 1991, Barvainis, Antonucci & Coleman 1992, Hughes et al. 1993). An example is shown in Figure 3.
|
Figure 3. The radio-UV SED of the
radio-quiet quasar, PG1351+640.
The combination of the FIR flux from IRAS and the mm upper limit
yeild an estimate for
|
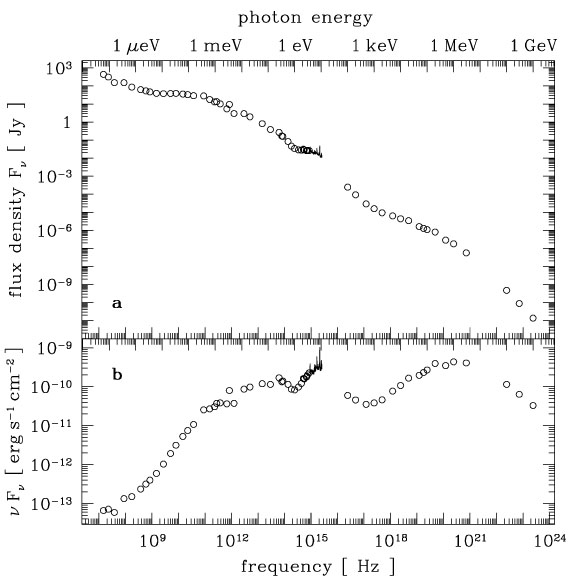
RLQs fall into two distinct groups generally believed to be distinguished by the orientation of the source to our line-of-sight. Core-dominated (CD) RLQs are those in which relativistically beamed, synchrotron emission is pointed directly at us and so is boosted. In these sources, the radio-IR SED tends to be smooth, suggesting that the IR is a higher-energy extension of the synchrotron emission in the radio. In Figure 4 the mean SED of CDRLQ 3C273 from the compilation of 30 years of multi-wavelength monitoring by Tuerler et al. (1998) is displayed. The SED extrapolates smoothly from the radio into the IR and is observed to vary in a coordinated manner (Courvoisier 1998), strongly arguing for non-thermal emission throughout the radio-mid-IR SED. In the near-IR, ~ 3µm, there is a narrow peak of emission which does not vary in the same way and is believed to originate in hot dust (Courvoisier 1998). Even in this well-established, non-thermal source, dust emission is an important contributor.
|
Figure 4. The average
radio- |
Lobe-dominated (LD) RLQs are dominated by extended emission on either side of the central AGN, powered by the relativistic jets which, in these sources, are not close to our line-of-sight. Studies of the radio-FIR SEDs of the core emission have revealed a discontinuity in the mm region which implies that emission in the FIR is unrelated to the non-thermal radio emission (Antonucci, Barvainis & Alloin 1990) and so favors a thermal origin for the FIR.
The radio properties of RQQs are typically either unresolved or with double, triple or linear structure providing strong evidence for jet-producing central engines similar to those in RLQs (Section 4.1.).
There is a second "bump" in typical quasar SEDs, the big blue bump (BBB),
which dominates the
optical-UV emission and often their total energy output. Since the X-ray
emission is generally below an extrapolation of this BBB, it is
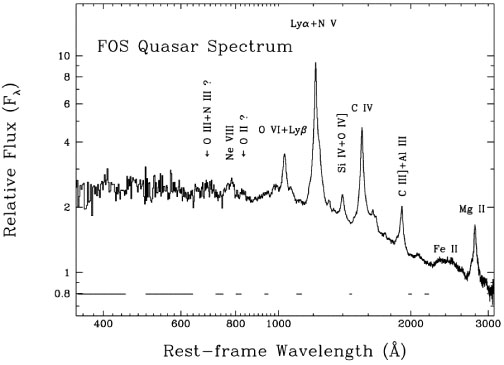
generally thought to peak in the EUV region. Recent, high-quality,
UV data (Figure 5,
Zheng et al. 1997)
shows evidence
for a peak in the far-UV in low-redshift objects. The detection of a
peak is a major
step forward as it allows constraints to be placed on the EUV emission,
which is the source of most of the ionising photons,
and on the relation between the UV and soft X-ray emission.
At high redshift a similar measurement is difficult due to the
affects of intervening absorption on the continuum shortward of the
Ly emission line.
|
Figure 5. The composite of 284 HST FOS spectra of 101 AGN (from Zheng et al. 1997, their Figure 5), showing a clear change in the continuum slope consistent with a peak ~ 1050Å. |
There are several components to the X-ray emission from AGN and their relative contributions differ depending on the type of object and energy range.
In RQQs and Sy1 galaxies, the mid-X-ray region (~ 1 - 5 keV) is
dominated by a power law with a slope
x ~ 1 (F

 -x,
Wilkes & Elvis 1987,
Reeves et al.
1997).
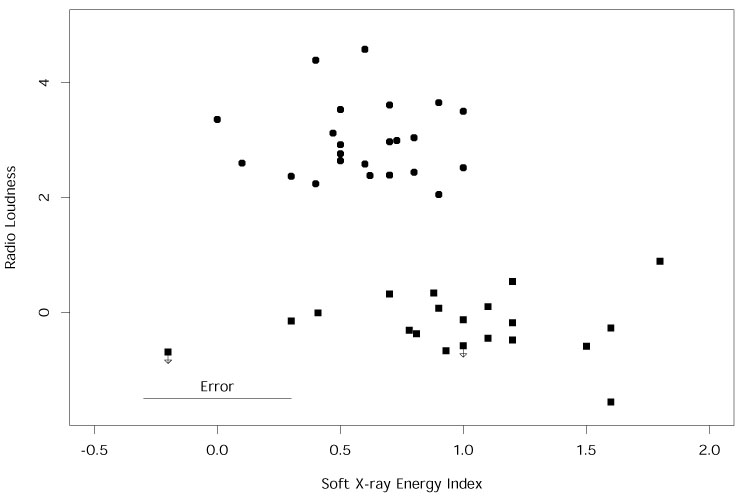
In the same spectral region, CDRLQs tend to have stronger emission
(Zamorani et al.
1981)
and flatter slopes,
x ~ 0.5, while
LDRLQs are
intermediate between the two (Figure 6,
Shastri et al.
1993,
Reeves et al.
1997,
Cappi et al. 1997).
-x,
Wilkes & Elvis 1987,
Reeves et al.
1997).
In the same spectral region, CDRLQs tend to have stronger emission
(Zamorani et al.
1981)
and flatter slopes,
x ~ 0.5, while
LDRLQs are
intermediate between the two (Figure 6,
Shastri et al.
1993,
Reeves et al.
1997,
Cappi et al. 1997).
|
Figure 6. The relation between radio
loudness and the Einstein soft
X-ray slope ( |
Although the slopes generally steepen towards lower energies (0.1-2 keV,
ROSAT band), RLQs remain relatively flatter than RQQs
(Laor et al. 1997).
These authors also suggest that this spectral difference may be linked
to the width of the broad
H
 4861 emission line rather than
the radio emission.
4861 emission line rather than
the radio emission.
At harder X-ray energies,
 5 keV, the spectrum
flattens,
particularly in low-luminosity objects. This feature, first reported by
Pounds et al.
(1990),
resulted in an apparent discrepancy between the low-energy (0.1-3.5 keV)
Einstein slopes
(Wilkes & Elvis 1987)
and those measured by EXOSAT over the harder, 2-10 keV, energy range
(Turner & Pounds
1989).
This flattening is generally weak or absent in higher luminosity quasars
(Williams et al.
1992,
Lawson & Turner 1997).
GRO OSSE observations show that the hard X-ray continuum of Sy1s generally
extends to 200 keV
(Gondek et al.
1996,
Zdziarski et al.
1994)
before a high energy cut-off occurs.
5 keV, the spectrum
flattens,
particularly in low-luminosity objects. This feature, first reported by
Pounds et al.
(1990),
resulted in an apparent discrepancy between the low-energy (0.1-3.5 keV)
Einstein slopes
(Wilkes & Elvis 1987)
and those measured by EXOSAT over the harder, 2-10 keV, energy range
(Turner & Pounds
1989).
This flattening is generally weak or absent in higher luminosity quasars
(Williams et al.
1992,
Lawson & Turner 1997).
GRO OSSE observations show that the hard X-ray continuum of Sy1s generally
extends to 200 keV
(Gondek et al.
1996,
Zdziarski et al.
1994)
before a high energy cut-off occurs.
A fluorescent, Fe K emission
line is commonly observed, again tending to be stronger in low
luminosity sources
(Nandra et
al.1997a,
b).
This Fe K line is often
broad, and sometimes double-peaked.
consistent with its origin in an accretion disk and, if so, providing
the only direct observations of this accretion disk to date
(Tanaka et al.
1995,
George & Fabian 1991,
Nandra these proceedings).
At soft energies,
 1 keV, the X-ray
spectra of ~ 50% of
both radio-loud and radio-quiet AGN steepens significantly to form the
soft excess
(Masnou et al.
1992).
This component generally dominates their
ROSAT (0.1-2 keV) spectra leading to systematically steeper
slopes at these energies
(Fiore et al. 1994,
Buehler et al.
1995).
The soft
excess can be extremely steep and is often called the ultra-soft excess
(Puchnarewicz et
al. 1992,
Boller, Brandt & Fink
1996).
Given the general increase of both the BBB on the low
energy and the ultra-soft excess on the high energy side of the EUV region,
it is tempting to identify both as part of the same, BBB component.
There is little direct evidence to this effect, for example observations of
coordinated variability, but circumstantial evidence includes the
anti-correlation of optical and soft X-ray slopes
(Puchnarewicz et
al. 1996)
and the extrapolation of the soft X-ray into the UV region
(Laor et al. 1997).
1 keV, the X-ray
spectra of ~ 50% of
both radio-loud and radio-quiet AGN steepens significantly to form the
soft excess
(Masnou et al.
1992).
This component generally dominates their
ROSAT (0.1-2 keV) spectra leading to systematically steeper
slopes at these energies
(Fiore et al. 1994,
Buehler et al.
1995).
The soft
excess can be extremely steep and is often called the ultra-soft excess
(Puchnarewicz et
al. 1992,
Boller, Brandt & Fink
1996).
Given the general increase of both the BBB on the low
energy and the ultra-soft excess on the high energy side of the EUV region,
it is tempting to identify both as part of the same, BBB component.
There is little direct evidence to this effect, for example observations of
coordinated variability, but circumstantial evidence includes the
anti-correlation of optical and soft X-ray slopes
(Puchnarewicz et
al. 1996)
and the extrapolation of the soft X-ray into the UV region
(Laor et al. 1997).
Studies of X-ray slopes as a function of redshift show changes which
correspond well to these various components moving through the observed
band as the redshift increases. Comparison of the slopes
using a constant intrinsic energy range shows no dependence of
x on redshift
(Elvis et al. 1994,
Cappi et al. 1997).
Another key component of X-ray spectra of quasars and Sy galaxies is absorption by cold and/or warm material. Sy1 galaxies and quasars typically show low absorption column densities (NH ~ 1020 - 21 cm-2) often including ionised absorption edges indicating the presence of warm material (Halpern 1984). This warm material has been suggested to originate in the same material as that responsible for the narrow associated UV absorption lines common in many types of AGN (Mathur, Elvis & Wilkes 1995 and references therein).
 -ray SED of the
core-dominated, radio-loud quasar
-ray SED of the
core-dominated, radio-loud quasar