Copyright © 1994 by Annual Reviews. All rights reserved
| Annu. Rev. Astron. Astrophys. 1994. 32:
531-590 Copyright © 1994 by Annual Reviews. All rights reserved |


One of the most important signatures of the black hole scenario would be
the infrared/submillimeter background generated by the stellar
precursors. In
Section 5.1 we discussed a general constraint
on  *(M), which depended
only on the fact that the background light must appear in some
waveband.
Here we discuss more precise constraints for VMOs, exploiting the fact that
we can predict the waveband in this case very exactly. The calculation
can be extended to cover the mass range below 100
M
*(M), which depended
only on the fact that the background light must appear in some
waveband.
Here we discuss more precise constraints for VMOs, exploiting the fact that
we can predict the waveband in this case very exactly. The calculation
can be extended to cover the mass range below 100
M , but
that range may be excluded
by nucleosynthetic constraints anyway. We also consider the generation of
gravitational radiation by VMO or SMO black holes.
, but
that range may be excluded
by nucleosynthetic constraints anyway. We also consider the generation of
gravitational radiation by VMO or SMO black holes.
8.1 Background Light Observations
The detection of cosmological background radiation in the IR and
submillimeter
bands is difficult because of foregrounds from scattered zodiacal light
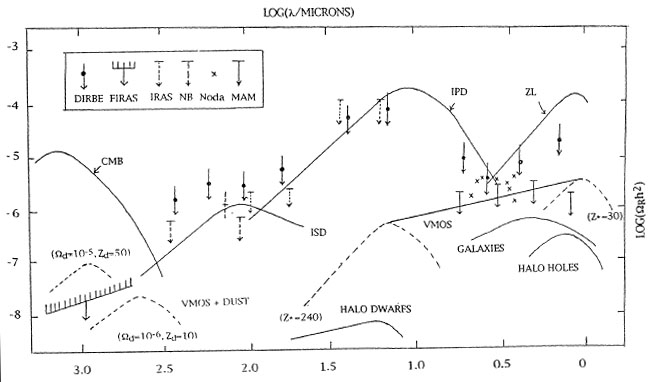
(ZL), interplanetary dust (IPD), and interstellar dust (ISD). Estimates
of these competing backgrounds are shown in
Figure 6, where the background light
intensity I( )
has been expressed in critical density units by defining a quantity
R()
)
has been expressed in critical density units by defining a quantity
R()
 4
4 I() /
c3
I() /
c3
 crit.
One sees that there are minima at around 4 µ, 100 µ,
and 400 µ, so these are the best "windows" in which to search
for an extragalactic
background. Although positive detections have been claimed in all of these
windows, none has been subsequently confirmed, so only upper limits on
R()
are currently available; we begin by summarizing these. For comparison, the
CMB peaks at
peak =
1400 µ with a density
R = 2
× 10-5h-2.
crit.
One sees that there are minima at around 4 µ, 100 µ,
and 400 µ, so these are the best "windows" in which to search
for an extragalactic
background. Although positive detections have been claimed in all of these
windows, none has been subsequently confirmed, so only upper limits on
R()
are currently available; we begin by summarizing these. For comparison, the
CMB peaks at
peak =
1400 µ with a density
R = 2
× 10-5h-2.
|
Figure 6. Comparison of the observational
constraints on the extragalactic background radiation
density from DIRBE, FIRAS, IRAS, Nagoya-Berkeley (NB), Malsumoto
et al (MAM), and Noda et
al with the background expected in the VMO scenario for different dust
abundances. Also shown
are the CMB, the local foregrounds, and the background from galaxies,
accreting 106
M |
The FIRAS results
(Mather et al 1990,
1994)
imply that the CMB is so
well fit by a black-body spectrum that any extra background must have an
intensity less than 0.03% of the CMB density over the range
500-5000 µ. This implies
R() < 6 ×
10-9
h-2(
/ peak)-1. The DIRBE results at
the south ecliptic pole
(Hauser et al 1991)
give upper limits in the J, K, L, M, 12 µ, 25 µ,
60 µ, 100 µ, 120-200 µ and
200-300 µ bands. However, the limits indicated in
Figure 6 are very conservative since they do not include any subtraction for
the foreground backgrounds from interstellar and interplanetry dust. Careful
modeling of these foreground contributions may improve the limits.
Figure 6
includes the limits derived by
Oliver et al (1992)
by using IRAS and DIRBE data
in conjunction with detailed dust models. It also shows the limits
obtained from an analysis
(Lange et al 1991)
of the Nagoya-Berkeley rocket data
(Matsumoto et al 1988a).
At one stage IRAS data seemed to indicate a 100 µ
background with
R(100 µ) = 3 ×
10-6h-2
(Rowan-Robinson 1986)
but this is inconsistent with the DIRBE results.
The DIRBE and IRAS limits are very weak around
12 µ and 25 µ because
the interplanetary dust emission is so large. In the near-IR, a Japanese
rocket experiment
(Matsumoto et al 1988b)
gave a limit R(1-5 µ) < 3 × 10⁻⁵
h-2
with the possible detection of a "line" at 2.2 µ with
R(2.2 µ) = 3 ×
10-6h-2.
However, this claim was always controversial because of the problem of
subtracting starlight and rocket exhaust. Recent observations by
Noda et al (1992)
give R(1.6-4.7 µ) < 3 ×
10-6h-2, which seems to exclude such a line.