Copyright © 1988 by Annual Reviews. All rights reserved
| Annu. Rev. Astron. Astrophys. 1988. 26:
631-86 Copyright © 1988 by Annual Reviews. All rights reserved |


The discussion in the previous sections summarizes evidence for the
existence of structures on the scale of
~ 10 - 150h-1 Mpc. A question of
critical importance is what are the velocity fields in these
structures. Peculiar velocities of clusters on these scales may
indicate the existence of large amounts of (dark) matter and are of
fundamental importance for models of galaxy and structure formation.
Early discussions of possible peculiar velocities among clusters in
superclusters were presented by
Abell (1961)
and
Noonan (1977).
Noonan observed a tendency of clusters with neighboring Abell clusters to
have a greater scatter on the Hubble diagram, which was interpreted as
a gravitational perturbation on the cluster redshifts due to the
neighboring clusters. More recently,
Bahcall et al. (1986)
used the complete redshift sample of D
 4 rich Abell clusters
(Section 2) to
study the possible existence of peculiar motion and/or structural
anisotropy on large scales. They find strong broadening in the
redshift distribution that corresponds to a cluster velocity of ~
103 km s-1. These findings are summarized below.
4 rich Abell clusters
(Section 2) to
study the possible existence of peculiar motion and/or structural
anisotropy on large scales. They find strong broadening in the
redshift distribution that corresponds to a cluster velocity of ~
103 km s-1. These findings are summarized below.
Recent observations of galaxy peculiar velocities on large scales (Rubin et al. 1976, Dressler et al. 1987, Aaronson & Mould 1988) indicate motion, or a bulk flow, on the scale of approximately 60h-1 Mpc toward a large mass concentration; the indicated motion is about 600 km s-1 relative to the microwave background. Yahil (1988) and Strauss & Davis (1988) used the IRAS galaxy survey to trace the gravitational field over a comparable volume around us. They suggest that velocity flows exist mostly on smaller scales around various local density enhancements (superclusters).
8.1. Redshift Elongation: The "Finger-of God" Effect
The distribution in space of the D
4 redshift sample of Abell
clusters was studied by
Bahcall et al. (1986)
by separating the
three-dimensional distribution into its components along the
line-of-sight (redshift) axis and the perpendicular axes projected on
the sky. All clusters were assumed to be located at their Hubble
distances as indicated by their redshifts, and their pair separations
(in megaparsecs) were determined in the three components. A
scatter-diagram of the cluster pair separations in the redshift (z)
direction (Rz) versus their separations in
 or
or
 (R or
R) was
then determined.
(R or
R) was
then determined.
If all clusters were located at their Hubble distances with
negligible peculiar motion, and if the sample was not dominated by
elongated structures in a given direction, a symmetric scatter diagram
should be observed. If a large peculiar velocity exists among
clusters, it would manifest itself as an elongated distribution along
the z-direction in the Rz -
R and
Rz -
R
diagrams. This elongation,
often called the "Finger-of-God" effect, is normally interpreted as
peculiar motion. However, the effect may also be caused by
geometrically elongated structures if they dominate the sample (with
elongation in the z-direction; see below).
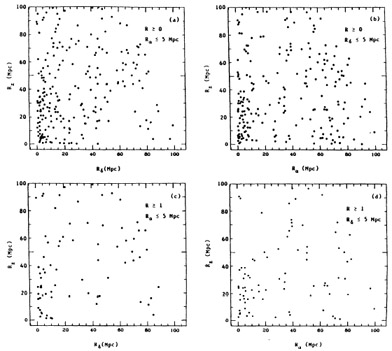
The results are presented in Figures 19 to
21. The scatter diagrams
are plotted in Figure 19 for both the R
 0 and R
1
samples. Frequency distributions representing these diagrams are
presented in Figure 21. A strong and
systematic elongation in the
z-direction exists in all the real samples studied. Scatter diagrams
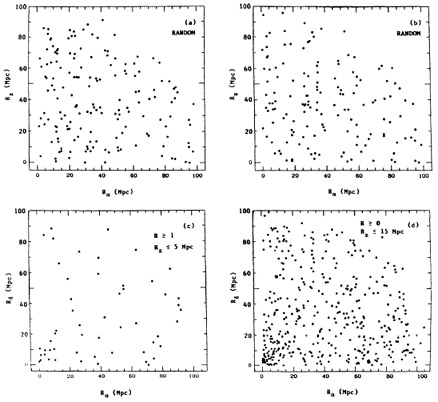
for sets of random catalogs do not exhibit any conspicuous elongation
(Figure 20), as expected; a symmetric
distribution in all directions is observed. As an additional test,
Bahcall et al. (1986)
also determined the scatter diagrams in the projected plane
R -
R, of the
cluster sample (Figure 20). Again, as expected,
a symmetric
distribution is observed in this plane. These tests strengthen the
conclusion that the observed elongation is real. The effect of
elongation is strong; statistically, it corresponds to approximately
8
0 and R
1
samples. Frequency distributions representing these diagrams are
presented in Figure 21. A strong and
systematic elongation in the
z-direction exists in all the real samples studied. Scatter diagrams
for sets of random catalogs do not exhibit any conspicuous elongation
(Figure 20), as expected; a symmetric
distribution in all directions is observed. As an additional test,
Bahcall et al. (1986)
also determined the scatter diagrams in the projected plane
R -
R, of the
cluster sample (Figure 20). Again, as expected,
a symmetric
distribution is observed in this plane. These tests strengthen the
conclusion that the observed elongation is real. The effect of
elongation is strong; statistically, it corresponds to approximately
8 in a single sample
(assuming, for illustrative simplicity, Gaussian
statistics). It is therefore unlikely that the observed redshift
elongation is a chance fluctuation. The effect becomes more apparent
in the larger R 0
sample; this increase is expected if the effect is real.
in a single sample
(assuming, for illustrative simplicity, Gaussian
statistics). It is therefore unlikely that the observed redshift
elongation is a chance fluctuation. The effect becomes more apparent
in the larger R 0
sample; this increase is expected if the effect is real.
|
Figure 19. Scatter diagrams of Abell
cluster pair separations (in
megaparsecs) in the Rz -
R |
A similar effect was observed by BS83 in their comparison between
the cluster correlation function in the redshift and spatial
directions. A broadening in the redshift direction was observed in
that study, similar to the present findings. The elongation is
unlikely to be caused by background/foreground contamination of
galaxies and clusters (e.g.
Sutherland 1988),
since this would yield
an excess of pairs at any Rz separation, as well as any
R or
R,
rather than the excess (i.e. broadening) observed specifically at
small separations ( 0.015). The effect is also much larger than
either the uncertainties in the redshift measurements or the
uncertainties caused by the internal velocity dispersion within the
clusters (see below).
0.015). The effect is also much larger than
either the uncertainties in the redshift measurements or the
uncertainties caused by the internal velocity dispersion within the
clusters (see below).
|
Figure 20. Same as
Figure 19 but for typical random distribution of
clusters (a, b), and for the projected distribution
(i.e. R |
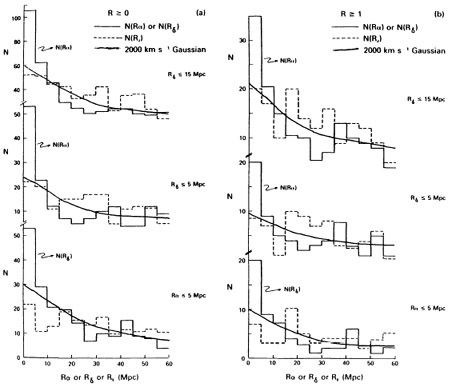
To determine what velocity could cause the observed effect, the
authors convolved the frequency distribution observed along the
projected axis, which is unperturbed by peculiar motion, with a
Gaussian velocity distribution. A Gaussian form is assumed for
convenience in estimating the velocity broadening. This convolved
distribution should match the broadened distribution observed in the
redshift direction. The best fit is obtained for a velocity width of
 2
2
 2000 km
s-1. The estimated uncertainty on this mean velocity is
approximately +1000/ -500 km s-1. The above result is
consistent with
the results of BS83, who used the redshift broadening observed in the
cluster correlation function.
2000 km
s-1. The estimated uncertainty on this mean velocity is
approximately +1000/ -500 km s-1. The above result is
consistent with
the results of BS83, who used the redshift broadening observed in the
cluster correlation function.
|
Figure 21. Histograms representing the
distribution of pairs along the
redshift, Rz, and projected,
R |
The above value for the velocity width includes all contributions to
the broadening effect, such as redshift measuring uncertainty and
possible deviations from the true cluster redshift due to individual
galaxy velocities in the clusters. Redshift measuring uncertainties
are negligible compared with the 2000 km s-1 velocity width
observed. The effect of peculiar motion within the clusters (for those
clusters that have only a small number of measured galaxy redshifts)
was estimated by comparing cluster redshifts from the current sample
with those obtained using a larger number of measured galaxy
redshifts, when available. For the latter study
(Bahcall et al. 1986),
the redshift catalogs of
Sarazin et al. (1982)
and Fetisova (1981)
were used. A root-mean-square deviation for these cluster redshifts of
approximately 300 km s-1 is observed due to the above
effect. This
value is reasonable considering that the full velocity dispersion in
clusters is typically ~ 1000 km s-1, and that the redshifts
measured are for the brightest centrally located galaxies; these
galaxies are generally close to the central velocity of the
cluster. Subtracting quadratically a possible deviation of 300
2 km s-1 from
the observed
2000 km s-1 yields 1950 km s-1, i.e. a negligible
change. Even if we
assume, conservatively, ~ 700 km s-1 for the internal
broadening, the
net cluster pair velocity is still 1740 km s-1. Thus, a
considerable elongation effect of approximately 103 km
s-1 per cluster remains after correction for internal motion.
The observed elongation may be caused by either peculiar motion of clusters or a true geometrical elongation of superclusters. These are briefly discussed below.
8.2. Explanations of the Redshift Elongation
8.2.1 PECULIAR VELOCITY AMONG CLUSTERS If the observed elongation is caused primarily by peculiar motion of clusters in superclusters, the net cluster pair motion in the line of sight is approximately 1700 km s-1, or, equivalently, about 1200 km s-1 for single cluster motion. Most of this effect arises in the central parts of the rich superclusters. A large peculiar velocity could be caused by the gravitational potential of the superclusters or by nongravitational effects such as explosions.
To estimate a supercluster mass that may support this velocity, a
typical supercluster size of
~ 25h-1 Mpc (= cluster correlation scale
length) is used and the virial relation
M  v2r is assumed. This
yields a typical supercluster mass of
v2r is assumed. This
yields a typical supercluster mass of

| (19) |
This mass is comparable to the mass of ~ 20 rich clusters, while typically only ~ 3 - 5 rich clusters are members of a supercluster. Even when the luminous tails of clusters are accounted for, the result may still suggest an excess of dark matter in superclusters as compared with clusters. Using an observed luminosity and/or density profile of r-3 or r-2.5 around a rich cluster, we estimate an M/L for superclusters that is typically twice that of rich clusters, i.e. M/L ~ 500.
Redshift observations of two individual higher redshift superclusters (Ciardullo et al. 1983) appear to indicate a much lower velocity for the superclusters than suggested even by a free expansion. This suggests, for these two systems, either a flat face-on geometry of the superclusters (consistent with Section 8.2.2) or a slow-down of the initial expansion due to the supercluster mass. In either case, it is likely that individual superclusters are at different stages of their evolution as well as at different observed orientations. The Corona Borealis supercluster (Bahcall et al. 1986) appears to show a redshift elongation in the distribution of both its clusters and the galaxies.
8.2.2 GEOMETRICAL ELONGATION OF SUPERCLUSTERS The elongation observed in the scatter diagrams may also be caused, at least partially, by a geometrical elongation of superclusters. If the most prominent superclusters are elongated in the line-of-sight direction, an apparent elongation in the distribution of pair separation along this axis may result. I discuss below an observational test to distinguish between peculiar velocity and geometrical elongation of large-scale structures.
8.2.3 TESTS TO DISTINGUISH BETWEEN
PECULIAR VELOCITY AND GEOMETRICAL ELONGATION If the
observed redshift elongation is caused by geometrical
elongation, cluster redshifts should be correlated with the magnitude
of their standard galaxies, following Hubble's law. No such
magnitude-redshift correlation should be present if the effect is
entirely due to peculiar velocity. More generally, an independent
distance indicator (such as the magnitude of the brightest cluster
galaxy or Tully-Fisher-type relations) could be used to determine the
actual distances to the clusters and thus to interpret the origin of
the observed redshift broadening (by comparing the actual distances
with the observed redshifts).
The dependence of galaxy magnitudes on redshift in the close cluster
pairs was studied by
Bahcall et al. (1986).
The magnitude of the brightest galaxy in each cluster,
m1c, corrected for the cluster
morphological type and richness as given by
Hoessel et al. (1980),
was used as a distance indicator. If the observed redshift elongation is
caused by geometrical anisotropy, a proper (Hubble) correlation of
m1c
with z is expected within individual superclusters. This correlation
should not exist if peculiar velocity is the cause of the observed
elongation. The expected magnitude difference for a cluster pair with
a redshift separation of about 0.01-0.015, assuming Hubble
distances, is ~ 0.3 to 0.5 mag (depending on z). This difference is
large enough to be measured with accurate observations of standard
galaxy magnitudes. A marginal
m1c dependence was found
(Bahcall et al. 1986)
for some individual superclusters, suggesting that at least
some of the redshift broadening observed may be due to geometrical
elongation of the large structures. Increased accuracy and greater
statistics for galaxy magnitudes may clarify the significance of the
results. It is possible that both geometrical elongation and peculiar
velocity of clusters contribute to the observed redshift
broadening. Other distance indicators, such as Tully-Fisher or
Faber-Jackson relations, should also be applied to the problem in
order to help distinguish between peculiar motion and
geometry. Recently, comparable velocities of ~ 103 km
s-1 between some cluster pairs were also suggested by
Mould (1988)
and
Burstein (1988)
using actual distance indicators of galaxies.