


2.2. Integrated properties
The overriding result of all ISOPHOT studies of the integrated properties of normal galaxies in the FIR is that their SEDs in the 40-200 µm spectral range require both warm and cold dust emission components to be fitted. Although the concept of warm and cold emission components is as old as IRAS (de Jong et al. 1984), it only became possible to directly measure and spectrally separate these components using ISOPHOT's multi-filter coverage of the FIR regime out to 200 µm.
In the MIR the two most stunning results are the high similarity of the disk's SED in spiral galaxies and the almost complete invariance of the global MIR colours to the actual star-formation activity of the galaxy as a whole. The former result shows that the MIR emission comes predominantly from PDRs, whereas the latter result demonstrates the importance of the emission from the central region to the MIR, a characteristic which could only be uncovered due to the high spatial resolution offered by ISOCAM.
In order to investigate the integrated properties of local universe gas-rich galaxies, a number of statistical samples were constructed, which were primarily observed by ISOPHOT and ISOCAM. All these projects were complementary in terms of selection and observational goals. In descending order of depth (measured in terms of a typical bolometric luminosity of the detected objects), the published surveys are:
The ISO Virgo Cluster Survey is a combination of the
ISOPHOT Virgo Cluster Deep Survey (IVCDS;
Tuffs et al. 2002a,
b;
Popescu et al. 2002)
and ISOCAM measurements
(Boselli et
al. 2003b, see also
Boselli et al. 1997)
of the same sample supplemented by additional targets on
the eastern side of
the cluster. The IVCDS represents the deepest survey (both in
luminosity and surface brightness terms) of normal galaxies
measured in the FIR with ISO. A complete volume- and luminosity-limited
sample of 63 gas-rich Virgo Cluster galaxies selected from the Virgo
Cluster Catalogue
(Binggeli et al. 1985;
see also
Binggeli et al. 1993)
with Hubble types later than S0 and brighter than
BT  16.8 were
mapped with ISOPHOT at 60, 100 and 170 µm.
A total of 99 galaxies were mapped with ISOCAM in the 6.7 and 15
µm filters. The IVCDS sample was (in part) also observed
with the LWS
(Leech et al. 1999).
16.8 were
mapped with ISOPHOT at 60, 100 and 170 µm.
A total of 99 galaxies were mapped with ISOCAM in the 6.7 and 15
µm filters. The IVCDS sample was (in part) also observed
with the LWS
(Leech et al. 1999).
The ISO Virgo Cluster Survey provides a database for statistical investigations of the FIR and MIR SEDs of gas-rich galaxies in the local universe spanning a broad range in star-formation activity and morphological types, including dwarf systems and galaxies with rather quiescent star-formation activity.
The Coma/A1367 Survey Contursi et al. 2001 consists of 6 spiral and 12 irregular galaxies having IRAS detections at 60 µm. The galaxies were selected to be located within 2 or 1 degrees of the X-ray centres of Coma and A1367 clusters, respectively, with emphasis on peculiar optical morphologies. Each galaxy was observed in a single pointing with ISOPHOT, at 120, 170 and 200 µm, as well as mapped with ISOCAM in the 6.75 and 15 µm broadband filters. The sample provides a database of integrated flux densities for a pure cluster sample of high luminosity spiral and irregular galaxies.
The ISO Bright Spiral Galaxies Survey
(Bendo et al. 2002a,
b;
2003)
consists of 77 spiral and S0
galaxies chosen from the Revised Shapley-Ames Catalog (RSA), with
BT
12.0. Almost all are IRAS sources. Mainly an ISOCAM
mapping survey with the 12 µm filter, the
project also used ISOPHOT to take 60, 100 and 170 µm short
stares towards the nucleus of the galaxies and towards background
fields. The sample provides a database of MIR morphologies and FIR surface
brightnesses of the central regions of bright spiral galaxies, including
S0s.
The ISO Bright Spiral Galaxies Survey and the ISO Virgo Cluster Survey represent the principle investigations of optically selected samples of normal galaxies. It should be emphasised that the main difference between them is primarily one of shallow versus deep, rather than field versus cluster, since by design the Virgo Sample predominantly consists of infalling galaxies from the field, and no cluster specific effects could be found (see also Contursi et al. for Coma/A1367 Sample).
The ISO Key Project on Normal Galaxies Sample Dale et al. 2000 consists of 69 galaxies selected to span the whole range of the classical IRAS colour-colour diagram Helou 1986. Since IRAS detected a vast number of galaxies in its four bands, the selection was also made to span the Hubble sequence evenly and provide a broad range of IR luminosities, dust temperatures (as determined by IRAS) and star-formation activity. Galaxies in the sample were mapped with ISOCAM, their main cooling lines in the FIR were measured with ISOLWS Malhotra et al. 2001 and their 2.5-12 µm spectra were measured with ISOPHOT-S Lu et al. 2003.
The ISOCAM Parallel Mode Survey Ott et al. 2003 is drawn from observations made with ISOCAM, mostly around 6 µm, while another ISO instrument was prime. It detected around 16000 distinct objects down to 0.5mJy. Identifications of these objects by cross-correlation with other catalogues is on-going and ~ 25% of the objects are expected to be galaxies.
The ISOPHOT Serendipity Survey
(Stickel et al. 2000)
has initially catalogued 115 galaxies with
S
 2Jy at 170 µm
and with morphological types predominantly S0/a-Scd. This sample
provides a database of integrated 170 µm flux densities for
relatively high luminosity spiral galaxies, all detected by IRAS at 60
& 100 µm. Recently a catalogue of 1900 galaxies was released
(Stickel et al. 2004),
of which a small fraction does not have IRAS
detections. Most of the 1900 galaxies are spirals. The
measured 170 µm flux densities range from just below 0.5Jy up
to ~ 600Jy.
2Jy at 170 µm
and with morphological types predominantly S0/a-Scd. This sample
provides a database of integrated 170 µm flux densities for
relatively high luminosity spiral galaxies, all detected by IRAS at 60
& 100 µm. Recently a catalogue of 1900 galaxies was released
(Stickel et al. 2004),
of which a small fraction does not have IRAS
detections. Most of the 1900 galaxies are spirals. The
measured 170 µm flux densities range from just below 0.5Jy up
to ~ 600Jy.
Finally about 30 additional spiral galaxies were mapped in various ISO guaranteed and open time programs (see Roussel et al. 2001c, for a compilation)
2.2.1. The FIR spectral energy distribution: Dust temperatures, masses and luminosities
The presence of a cold dust emission component peaking longwards of 120 µm was inferred from studies of the integrated SEDs of individual galaxies (see Sect. 2.1.1), from statistical studies of small samples (Krügel et al. 1998; Siebenmorgen et al. 1999) and was confirmed and generalised by studies of the larger statistical samples mentioned above. The latter studies also demonstrated the universality of the cold dust component, showing it to be present within all types of spirals (Tuffs & Popescu 2003). The cold emission component predominantly arises from dust heated by the general diffuse interstellar medium and the warm component from locally heated dust in HII regions, an interpretation consistent with what has been seen in the ISOPHOT maps of nearby galaxies (see Sect. 2.1.1) and with self-consistent modelling of the UV-FIR SEDs (see Sect. 2.3).
The cold dust component is most prominent in the most "quiescent" galaxies, like those contained in the IVCD sample, where the cold dust temperatures were found to be broadly distributed, with a median of 18K (Popescu et al. 2002), some 8 - 10K lower than would have been predicted by IRAS. The corresponding dust masses were correspondingly found to be increased by factors of typically 2 - 10 (Stickel et al. 2000) for the Serendipity Sample and by factors 6 - 13 (Popescu et al. 2002) for the IVCD sample, with respect to previous IRAS determinations. As a consequence, the derived gas-to-dust ratios are much closer to the canonical value of ~ 160 for the Milky Way (Stickel et al. 2000, Contursi et al. 2001; see also Haas et al. 1998 for M 31), but with a broad distribution of values (Popescu et al. 2002).
It was found that the cold dust component provides not only the bulk of the dust masses, but even the bulk of the FIR luminosity, in particular for the case of the most quiescent spirals, like those in the IVCD sample. In contrast to the SEDs found by the other ISOPHOT studies, which typically peaked at around 170 µm, Bendo et al. (2003) derived spatially integrated SEDs typically peaking at around 100 µm. The result of Bendo et al. may reflect the fact that these observations were single pointings, made towards the nucleus of resolved galaxies extending (in the main) beyond the field of view of ISOPHOT, and were therefore biased towards nuclear emission, which is warmer than the extended cold dust emission missed (or only partially covered) by these measurements. Nevertheless, the measurements of Bendo et al. constitute a useful probe of the FIR emission of the inner disks. This emission (normalised to K band emission) was found to increase along the Hubble sequence (Bendo et al. 2002b).
Since the FIR carries most of the dust luminosity, it is interesting to re-evaluate the question of the fraction of stellar photons converted via grains into IR photons, taking into account the comprehensive measurements of the cold dust emission component made available by ISOPHOT. This was done by Popescu & Tuffs (2002a), who showed that the mean percentage of stellar light reradiated by dust is ~ 30% for the Virgo Cluster spirals contained in the IVCD sample. This study also included the dust emission radiated in the NIR-MIR range. The fact that the mean value of ~ 30% found for the Virgo Cluster spirals is the same as the canonical value obtained for the IRAS Bright Galaxy Sample (BGS; Soifer & Neugebauer 1991) is at first sight strange, since IRAS was not sensitive to the cold dust component. However the BGS sample is an IR selected sample and biased towards galaxies with higher dust luminosities, while the Virgo sample is optically selected and contain a full representation of quiescent systems. So the deficit in FIR emission caused by sample selection criteria for the Virgo sample is compensated for by the inclusion of the cold dust component. Popescu & Tuffs (2002a) also found evidence for an increase of the ratio of the dust emission to the total stellar emitted output along the Hubble sequence, ranging from typical values of ~ 15% for early spirals to up to ~ 50% for some late spirals. This trend was confirmed by Boselli et al. 2003a who further utilised the new ISO data on dust emission to constrain the corresponding absorption of starlight and thus improve extinction corrections (using the technique pioneered by Xu & Buat 1995 for the IRAS data).
2.2.2. The NIR to MIR spectral energy distribution
Using the large body of NIR-MIR data - both photometric and spectroscopic - from the statistical studies mentioned previously, one can also determine the general properties of the SED of galaxies from the NIR to the MIR.
Concerning the colours of galaxies in the MIR, the main property that is evidenced is a remarkable uniformity of the 6.75 / 15 µm flux ratio. In contrast with the well-known IRAS colour-colour diagram, the composite ISO-IRAS colour diagram (showing the 6.75 / 15 µm flux ratio versus the 60 / 100 µm flux ratio, see Dale et al. 2000) shows a plateau of the 6.75 / 15 µm flux ratio for a large range of 60 / 100 µm flux ratios. A decrease of the ISO colour is only observed for the largest values of the IRAS colour. A rapid interpretation of that behaviour is that for most galaxies, the ISOCAM filters collect emission from transiently heated PAHs which shows no spectral dependence on the heating intensity. It is only for the most actively star-forming galaxies that a fraction of the 15 µm flux originates in hot dust located in the HII regions. This simple interpretation has to be taken with caution since it assumes that the integrated colour reflects a global property of the object (e.g. its star-forming activity). Indeed, following up on the fact that in the MIR the central regions of spiral galaxies appear to differ from the disk (see Sect. 2.1.2), Roussel et al. 2001b inspected the behaviour of the 6.75 / 15 µm flux ratio separately for disks and central regions. This revealed that the disk colours are extremely similar from one galaxy to the other and that it is the fraction of the total flux emitted from the central region combined with the colour of that region that dominate the variation of the global 6.75 / 15 µm flux ratio, rather than the global level of star-formation activity (Fig. 9). We remark that, in principle, the decrease of the 6.75 / 15 µm flux ratio in the central regions could correspond to a drop of the 6.75 µm flux rather than to an increase of the 15 µm flux. That this is not the case is clearly demonstrated by the ISOCAM spectra of these central regions Roussel et al. 2001b that show the appearance of the expected small grains continuum at the long wavelength edge of the bandpass.
 |
Figure 9. On the left panel, we show the distribution of 15 / 6.75 µm flux ratio for the disks and central regions of spiral galaxies (taken from Roussel et al. 2001b). It is clear that the disks have a very uniform colour while the central regions explore a much larger range. On the left side, the global NIR-MIR SED (from Lu et al. 2003) reveals the dominance of the PAH features in the MIR, as well as the very small dispersion from one object or the other. Both PAH dominated spectra represent the average spectrum of the sample, with two different normalisation. The very small dispersion bars reveal the homogeneity of the sample. The thin solid and dotted lines are spectra from early-type galaxies, dominated by stars. |
This uniformity of the disk emission is confirmed by the spectroscopic study of Lu et al. 2003. With the spectroscopic capabilities of ISOPHOT-S, they showed that the 2.5-12 µm spectrum of spiral galaxies is indeed extremely uniform. The NIR part is dominated by the tail of photospheric emission, while the MIR part presents the classical features of PAH emission, with extremely small spectral variations of these features from one galaxy to the other (of the order of 20%, see Fig. 9). Furthermore, these variations are not related to the IRAS 60 / 100 µm colour or to the FIR-to-blue luminosity ratio. Thus, as revealed by the broad-band colours, it appears that the detailed SED of spiral galaxies in the MIR show very little dependence on the actual level of star-formation in the galaxy. Studies of the MIR SED of various regions in our own galaxies have shown that a spectrum such as that observed globally in spiral galaxies is prototypical of photo-dissociation regions (PDRs), e.g. the outer layers of molecular clouds exposed to moderately strong radiation fields (see e.g. van Dishoeck 2004). Hence the spatial distribution of the MIR emission revealed in Sect. 2.1 is fully consistent with the observed SED.
It should be noted, however, that the ISOPHOT-S spectral range is shorter than the one explored by the 15 µm filter of ISOCAM, and in fact covers a wavelength range that is not very sensitive spectrally to activity variations, as demonstrated by the study of starburst galaxies presented by Förster-Schreiber et al. 2003. Therefore it is from the combination of the nearly constant colours observed by Roussel et al. 2001b and the constant spectrum observed by Lu et al. 2003 that one can conclude that the 5-18 µm spectrum of galactic disks is dominated by the emission from PDRs, rather than from the HII regions themselves.
The systematic exploration of the NIR-MIR SED of spiral galaxies made possible by ISO offered a number of other important discoveries. First Lu et al. 2003 evidenced a new component of dust emission consisting of a "hot" NIR continuum emission. Its association with the ISM was made clear by the existence of a correlation between that NIR excess and the strength of the PAH features. However a physical explanation of this continuum is still lacking. Second, the strength of the PAH emission (which represents most, but not all of the MIR flux when defined as the 5-20 µm luminosity for instance), was found to be well correlated spatially with the 850 µm flux of bright regions inside a number of galaxies Haas et al. 2002. This can be interpreted as showing a close physical association between cold dust clouds and the PAHs, but, given the limited spatial resolutions involved, more likely indicates that the localised 850 µm emission comes essentially from the inside of the molecular clouds whose surfaces produce the PAH features. Finally Helou et al. 2001 found a strong correlation between the 5-10 µm luminosity and the [CII] line luminosities of actively star-forming galaxies from the sample of Malhotra et al. (2001). Since the [CII] emission from this sample mainly originates in PDRs (see Sect. 2.4.1), this correlation implies that PAHs, which dominate the 5-10 µm luminosities Lu et al. 2003, are also responsible for most of the gas heating in strongly star-forming galaxies.
2.2.3. Two outstanding questions of the IRAS era
The radio-FIR correlation
One of the most surprising discoveries of the IRAS all-sky survey was the very tight and universal correlation between the spatially integrated FIR and radio continuum emissions (de Jong et al. 1985; Helou et al. 1985; Wunderlich et al. 1987; see Völk & Xu 1994 for a review). However all the pre-ISO studies of the FIR/radio correlation were based on FIR luminosities derived from the IRAS 60 and 100 µm flux densities, and thus were missing the bulk of the cold dust luminosity. The ISOPHOT measurements at 60, 100 and 170 µm were used to redefined the FIR/radio correlation (Pierini et al. 2003b) for a statistical sample of spiral galaxies. The inclusion of the cold dust component was found to produce a tendency for the total FIR/radio correlation to become more non-linear than inferred from the IRAS 60 and 100 µm observations. The use of the three FIR wavelengths also meant that, for the first time, the correlation could be directly derived for the warm and cold dust emission components. The cold FIR/radio correlation was found to be slightly non-linear, whereas the warm FIR/radio correlation is linear. Because the effect of disk opacity in galaxies would introduce a non-linearity in the cold-FIR/radio correlation, in the opposite sense to that observed, it was argued that both the radio and the FIR emissions are likely to have a non-linear dependence on SFR. For the radio emission an enhancement of the small free-free component with SFR can account for this effect. For the cold FIR emission a detailed analysis of the dependence of local absorption and opacity of the diffuse medium on SFR is required to understand the non-linear trend of the correlation (see Pierini et al. 2003b).
The improved angular resolution of ISO compared with IRAS also allowed a more detailed examination of the local FIR-radio correlation on sub-kpc size galactic substructures. Hippelein et al. (2003) established the correlation for the star-forming regions in M 33. This correlation is shown in Fig 10, overplotted on the correlation for integrated emission from galaxies. It is apparent that the local correlation has a shallower slope (of the order of 0.9) than for the global correlation. It was argued that the local correlation is attributable to the increase with SFR of dust absorption in increased dust densities, and to local synchrotron emission from within supernova remnants, still confining their accelerated electrons. Both emission components play only a minor role in the well known global radio-FIR correlation, that depends on the dominant large-scale absorption/re-emission properties of galaxies.
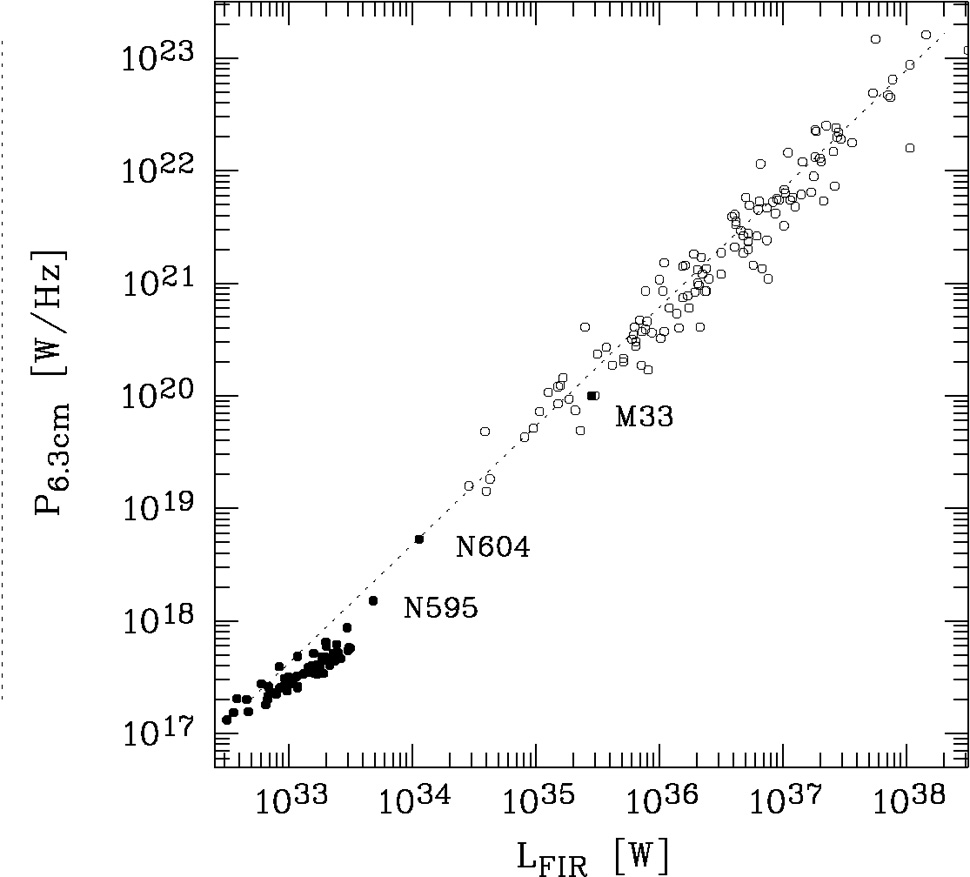 |
Figure 10. Plot of the monochromatic radio luminosity versus the FIR luminosities for M 33 (Hippelein et al. 2003) and its star-forming regions (filled circles) together with the data for the Effelsberg 100-m galaxy sample (Wunderlich et al. 1987, open circle). The dotted line has a slope of 1.10 (Wunderlich & Klein 1988). |
This local correlation has also been investigated in the MIR by Vogler et al. 2004. A good correlation was found between the two emissions on scales of ~ 500pc, which is comparable to the scales of the individual regions considered for the local FIR-radio correlation in M 33. The slope of the local MIR-radio correlation was comparable to that of the local FIR-radio correlation. This is consistent with the MIR and FIR emissions on scales of ~ 500pc being powered by the same UV photons.
Infrared emission as a star-formation tracer
Because star-forming regions and HII complexes shine brightly in the IR, and because starburst galaxies output most of their energy in the IR, this wavelength domain has always been associated with star-formation. As we have seen earlier, this is supported by a qualitative analysis of the IR emission of galaxies, but a quantitative assessment of this association has proven difficult. With the enhanced capacities of ISO, this question has been addressed in much more detail, and this reveals that the different regions of the IR SED have a different link with star-formation.
In the FIR, the correlation with the most widely-used star-formation
tracer, H , is extremely
non-linear, which has long led authors to
suspect that the FIR emission is the result of more than one component
(see e.g.
Lonsdale-Persson &
Helou 1987).
With ISOPHOT the correlation was separately established for the warm and
cold dust emission components. A good linear correlation was found
between the
warm FIR luminosities (normalised to the K band luminosity) derived for the
IVCD sample and their H
EW (Popescu et
al. 2002).
This is in agreement with the assumption
that the warm dust component is mainly associated with dust locally
heated within star-formation complexes. The scatter in the correlation was
attributed to a small component of warm emission from the diffuse
disk (produced either by transiently heated grains or by grains heated by
old stellar population), as well as to the likely variation in HII region
dust temperatures within and between galaxies. A good but non-linear
correlation was found between the cold FIR luminosities of the
galaxies from the IVCD sample and their
H EW, in the sense that
FIR increases more slowly than
H. Since the bulk of the
cold FIR emission arises from the diffuse disk, the existence of this
correlation implies that the grains in the diffuse disk are mainly
powered by the UV photons (see also
Sect. 2.3). The non-linearity of the
correlation is consistent with there being a higher contribution from
optical photons in heating the grains in more quiescent galaxies.
, is extremely
non-linear, which has long led authors to
suspect that the FIR emission is the result of more than one component
(see e.g.
Lonsdale-Persson &
Helou 1987).
With ISOPHOT the correlation was separately established for the warm and
cold dust emission components. A good linear correlation was found
between the
warm FIR luminosities (normalised to the K band luminosity) derived for the
IVCD sample and their H
EW (Popescu et
al. 2002).
This is in agreement with the assumption
that the warm dust component is mainly associated with dust locally
heated within star-formation complexes. The scatter in the correlation was
attributed to a small component of warm emission from the diffuse
disk (produced either by transiently heated grains or by grains heated by
old stellar population), as well as to the likely variation in HII region
dust temperatures within and between galaxies. A good but non-linear
correlation was found between the cold FIR luminosities of the
galaxies from the IVCD sample and their
H EW, in the sense that
FIR increases more slowly than
H. Since the bulk of the
cold FIR emission arises from the diffuse disk, the existence of this
correlation implies that the grains in the diffuse disk are mainly
powered by the UV photons (see also
Sect. 2.3). The non-linearity of the
correlation is consistent with there being a higher contribution from
optical photons in heating the grains in more quiescent galaxies.
For the late-type galaxies in the Coma and A1367 clusters,
Contursi et al. (2001)
derived the relationships between the IR flux
densities at 200, 170, 120, 100 and 60 µm, normalised to the
H band flux, as a function of the
H EW. It was found that
the poorer
correlation is in the 200 µm band and that the values of the
fitted slopes decrease as the FIR wavelength increases. These results
should be interpreted in terms of the increasing contribution of the
diffuse component with increasing FIR wavelength.
Using the ISOPHOT observations from Tuffs et al. (2002a, b) and Stickel et al. (2000) in combination with UV and K band photometry, Pierini & Möller (2003) have tried to quantify the effects of optical heating and disk opacity on the derivation of SFR from FIR luminosities. For this they investigated trends in the ratio of the far-IR luminosity to the intrinsic UV luminosity, Ldust / LUV, with both disk opacity and disk mass (as measured by the intrinsic K-band luminosity). Using a separate relation between disk opacity and K band luminosity they were able re-express Ldust / LUV in terms of a single variable, the galaxy mass In this way they found evidence for the relative importance of optical photons in heating dust to increase with increasing galaxy mass.
In the MIR, the correlation of global MIR and
H luminosities is also
non-linear
Roussel et al. 2001a,
but since the MIR SED
is so constant from galaxy to galaxy, an explanation along the lines
developed for the FIR correlation is not possible. However,
Roussel et al. 2001a
have shown that the non-linearity is due again
to the fact that the global MIR flux mixes together the contributions
from the central regions and the disk. Restricting their studies to
the disk emission, they showed that both the 6.75 µm and the
15 µm luminosities are linearly correlated with the
extinction-corrected H
luminosities (see Fig. 11). Therefore, although
the MIR emission from the
disk of spiral galaxies does not originate directly in the
star-forming regions, but rather from the PDRs around them, it is the
energy from the star-formation process that powers the MIR luminosity,
and Roussel et al. provide the conversion factors that allow the
derivation of the star-formation rate (SFR) from the MIR
luminosities. In a follow-up study,
Förster-Schreiber
et al. 2004
demonstrated that the 6.75 µm luminosity is still as good a
tracer of star-formation in the central
regions of spiral galaxies as it was in their disks. The non-linearity
observed in the global
6.75-H diagram is
attributed to the difference in extinction between disk and central
star-forming regions. For the 15 µm luminosities,
Förster-Schreiber
et al. 2004
showed that the star-formation activity observed in the central regions of
galaxies is such that it shifts the emission from very small grains
(usually emitting in the 20-60 µm range) toward shorter
wavelengths. Therefore, even when the
H emission is corrected for
the higher central extinction, the correlation with the 15
µm emission is not linear as grains that make the IR
emission change their thermal regime.
 |
Figure 11. The
MIR-H |