


ISOPHOT (Lemke et al. 1996; Laureijs et al. 2003) imaged three nearby galaxies (M 31: Haas et al. 1998; M 33: Hippelein et al. 2003 and M 101: Tuffs & Gabriel 2003) in the 60 to 200 µm range, with sufficient linear resolution to easily distinguish between the main morphological components in the FIR - nucleus, spiral arms and underlying disk. The main discovery, made possible by the unprecedented surface brightness sensitivity longwards of 100 µm, was the existence of large amounts of cold dust associated both with the spiral arms and with the underlying disk. This dust was too cold to have been seen by IRAS. Furthermore, ground-based submillimeter (submm) facilities lacked the surface brightness sensitivity to map the diffuse component of the cold dust associated with the underlying disk, though they detected the component associated with the spiral arms (e.g. Bianchi et al. 2000b).
In the case of the Sab galaxy M 31, most of the emission at
170 µm arises from the underlying disk, which has a completely
diffuse appearance (Fig. 1, left panel). This
diffuse disk
emission can be traced out to a radius of 22kpc, so the galaxy has a
similar overall size in the FIR as seen in the optical bands.
Fig. 1 (left panel) also shows that at
170 µm the
spiral arm component is dominated by a ring of 10kpc radius. In
addition, there is a faint nuclear source, which is seen more
prominently in HIRES IRAS 60 µm maps at similar resolution and
in H . The overall SED
(Fig. 1, right panel) can be
well described as a superposition of two modified
(
. The overall SED
(Fig. 1, right panel) can be
well described as a superposition of two modified
( = 2) Planck
curves, with dust temperatures TD of 16 and 45K. The cold
dust component at 16K arises from both the ring structure (30%)
and the diffuse disk (70%; Haas, private communication),
illustrating the importance of the diffuse emission at least for this
example. The 45K component matches up well with HII
regions within the star-formation complexes in the ring
structure. Associated with each star-formation complex are also compact,
cold emission sources (see Fig. 3 of
Schmitobreick et
al. 2000)
with dust
temperatures in the 15 to 20K range. These could well represent the
parent molecular clouds in the star-formation complexes which gave
rise to the HII regions. Detailed examination of the
morphology of the ring shows a smooth component of cold dust emission as
well as the discrete cold dust sources. Finally, the nuclear emission
was fitted by a 28K dust component.
= 2) Planck
curves, with dust temperatures TD of 16 and 45K. The cold
dust component at 16K arises from both the ring structure (30%)
and the diffuse disk (70%; Haas, private communication),
illustrating the importance of the diffuse emission at least for this
example. The 45K component matches up well with HII
regions within the star-formation complexes in the ring
structure. Associated with each star-formation complex are also compact,
cold emission sources (see Fig. 3 of
Schmitobreick et
al. 2000)
with dust
temperatures in the 15 to 20K range. These could well represent the
parent molecular clouds in the star-formation complexes which gave
rise to the HII regions. Detailed examination of the
morphology of the ring shows a smooth component of cold dust emission as
well as the discrete cold dust sources. Finally, the nuclear emission
was fitted by a 28K dust component.
 |
 |
Figure 1. Left: ISOPHOT 170
µm map of M 31
(Haas et al. 1998),
with an angular resolution of 1.3'. North is towards the top,
and East is towards the left. The field size is
2.9 × 2.9 degrees. Right: Infrared SED of M 31
(Haas et al. 1998).
The data are shown by symbols (diamonds ISO, crosses IRAS,
triangles DIRBE) with the size being larger than the errors. The
blackbody curves with emissivity proportional to
|
|
The ISOPHOT maps of the Sc galaxies M 33 and M 101 show the same morphological components as seen in M 31, with the difference that the spiral arm structure can be better defined in these later-type spirals. Also the star-formation complexes in the spiral arms show similar SEDs to those seen in M 31.
In conclusion, the characteristics of the FIR emission from the main morphological components of spiral galaxies are:
 TD
60K
from HII regions
TD
60K
from HII regions
TD
20K
from parent molecular clouds
TD
20KGenerally, ISOCAM (Cesarsky et al. 1996; Blommaert et al. 2003) maps of nearby galaxies are difficult to compare with their FIR counterparts from ISOPHOT, for two reasons. On the one hand ISOCAM's far superior angular resolution enables the mapping of detailed structures even within the spiral arm. On the other hand ISOPHOT's surface brightness sensitivity is far superior to that of ISOCAM, enabling faint diffuse emission on scales of galactic disks to be traced. ISOCAM's smaller PSF also meant that different galaxies were generally mapped in the MIR than in the FIR. M 31 and M 33 were too large to be completely mapped with ISOCAM.
Observations of a portion of the southern disk of M 31 were presented by Pagani et al. 1999. Due to the vastly different scales, these observations are particularly difficult to relate to those of Haas et al. 1998 but they nevertheless reveal that the detected MIR emission originates mostly in the regions of the spiral arms of Fig. 1. In fact, M 31 was completely mapped by Kraemer et al. 2002 at a number of MIR wavelengths with the Midcourse Space Experiment and their 8.3 µm map (their Fig. 1) is strikingly similar to that of Haas et al. 1998, with the difference that the diffuse emission detected in the FIR beyond the main spiral arms is not detected in the MIR. This difference could for instance be understood as being due to different parts of the grain size distribution having different spatial extents. However, generalising such a conclusion on the basis of the observation of M 31 alone could be dangerous, as it is known that some of the dust properties of this galaxy are very different from those of other galaxies, as revealed by it's atypical MIR spectrum Cesarsky et al. 1998.
A better grasp of the MIR morphology of spiral galaxies can be obtained from studies that completely mapped their targets. Such studies were predominantly made in the 6.75 and 15 µm broad band filters of ISOCAM (occasionally the ISOCAM 12 µm filter was used). These filters were chosen to trace different components of the MIR emission in galaxies. The 6.7 µm filter includes the most prominent spectral features emitted by Polycyclic Aromatic Hydrocarbons (PAHs) powered by UV photons, as revealed by spectroscopic studies of galactic sources. The 15 µm filter was originally chosen to trace stochastic emission from very small grains, though it subsequently turned out that PAH emission from the 12.7 µm feature and an underlying PAH continuum can also contribute and even dominate the signal seen towards the spiral arms. Morphological studies made using the above mentioned filters were presented by Malhotra et al. 1996] for NGC 6946, by Smith 1998 for NGC 7331, by Sauvage et al. 1996 for M 51 as well as by Bendo et al. 2002a, Dale et al. 2000 and Roussel et al. 2001c for larger samples of spiral galaxies. These papers show that, in the MIR, spiral galaxies present a morphology that is quite similar to that observed at other optical/NIR wavelengths. The spiral arms are very prominent, with the giant HII region complexes showing up as emission enhancements along the arms. A diffuse underlying MIR emitting disk is often detected in the interarm regions of the inner disk. Finally, a central region of varying importance is observed. A clear example of these morphological features is given in Fig. 2 where the 6.75 µm map of M 101 from Roussel et al. 2001c is presented. Although the central region of spiral galaxies is generally dominated optically by the bulge of old stars, one should not jump to the conclusion that the central MIR component is dominated by the Rayleigh-Jeans emission of cold photospheres or circumstellar envelopes. The extent of the central MIR source is generally different from that of the stellar bulge and furthermore Roussel et al. 2001b showed that its IR colours are generally not those expected from stars (i.e. the 15 / 6.75 µm flux ratio is generally larger than unity whereas the opposite applies in early-type galaxies where the stars provide most of the 6.75 µm emission, see Athey et al. 2002 or Xilouris et al. 2004, and Fig. 9). In fact, most of the emission from the central regions of spiral galaxies can be attributed to dust emission powered by enhanced star formation Roussel et al. 2001b.
 |
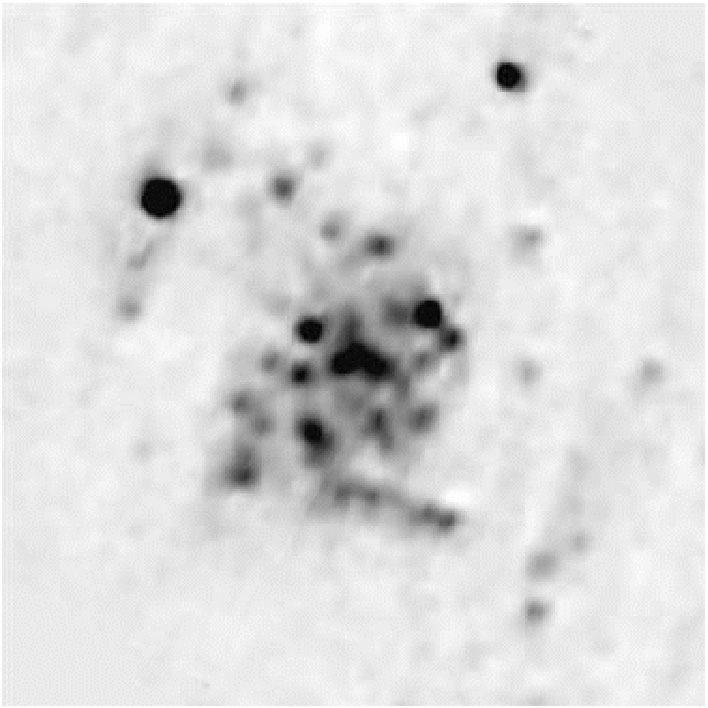
Figure 2. The 6.75 µm map of M 101, from Roussel et al. 2001c. The different features of the MIR morphology, central region, HII regions, spiral arms, are clearly seen. Diffuse interarm emission is also present but it becomes rapidly too faint to be detected. |
A further detailed study of the morphological features in the MIR is the
multiwavelength study of M 83 by
Vogler et al. 2004
who present the azimuthally averaged radial profiles of a number of
emission components of the
galaxy. These profiles show that the MIR emission of M 83 can be
decomposed into a central component, associated with the central
starburst, the prominent arm structure and a diffuse exponentially
fading disk emission. The arm/interarm
contrast was found to be larger in the MIR than it is in the optical,
although it was found to be smaller than what is observed in
H. This was interpreted
as being again due to the important, if not dominant role of star-formation
in powering the MIR emission, through the generation of UV
photons. The fact that
particles responsible for the MIR emission can be excited by a broad
range of photon energies (see e.g.
Uchida et al. 2000
and
Li & Draine 2002)
explains why the influence of star-forming regions is
seen on broader scales than the actual extent of HII
regions (see also Sect. 2.2.2).
An obvious question arising from these investigations pertains to the colour of the various MIR emission components (central regions, spiral arms, interarm regions), which could potentially be used to reveal the heating sources of MIR emission. Searches made in this direction came up with mixed results. For instance Sauvage et al. 1996 reported a systematic variation of the 15 / 6.75 µm flux ratio along some cuts through the arms of M 51, while Helou et al. 1996 showed that, on average, the 15 / 6.75 µm flux ratio is the same for the arm and interarm regions of NGC 6946, and Smith 1998 reported no systematic spectral variations in the disk of NGC 7331. The only systematic colour variations are observed in the central regions of spiral galaxies, where the 15 / 6.75 µm flux ratio can reach values observed in starburst galaxies Roussel et al. 2001b. Another study of the physical interpretation of the MIR morphology of spiral galaxies was presented by Dale et al. 1999. This shows that although star-formation activity is the primary driver for surface brightness variations inside galaxies, it is only for regions of intense activity that a colour variation occurs. Column density also appears as a secondary parameter to explain the difference in disk surface brightness between galaxies.
This relatively fast exploration of the IR morphology of spiral galaxies thus reveals how the same processes that affect their visible shapes, i.e. intensity and distribution of star-forming regions, play an important part in determining their IR aspect. It already suggests that the MIR and FIR part of the spectrum behave differently, in the sense that spectral modifications are more apparent in the FIR than in the MIR. This is not unexpected given the different thermodynamical states of the grains that produce these emissions, thermal equilibrium for most of the FIR, and stochastic heating for most of the MIR.
2.1.3. The extent of spiral disks in the FIR
Further information about the true distribution of dust in spiral disks is provided by FIR observations of galaxies more distant than the highly resolved local galaxies discussed in Sect. 2.1.1, but still close enough to resolve the diffuse disk at the longest FIR wavelengths accessible to ISO. In a study of eight spiral galaxies mapped by ISOPHOT at 200 µm, Alton et al. (1998; see also Davies et al. 1999 for NGC 6946) showed that the observed scalelength of FIR emission at 200 µm is greater than that found by IRAS at 60 and 100 µm. Thus, the scalelength of the FIR emission increases with increasing FIR wavelength. This result was reinforced using LWS (Clegg et al. 1996; Gry et al. 2003) measurements of the dust continuum by Trewhella et al. (2000), and can also be inferred from Fig. 2 of Hippelein et al. (2003) for M 33. We note here that this implies that the bulk of the 200 µm emission arises from grains heated by a radially decreasing radiation field, as would be expected for grains in the diffuse disk. If most of the 200 µm emission had arisen from localised sources associated with the parent molecular clouds within the spiral arms, there should be no FIR colour gradient in the galaxy, since the SEDs of the localised sources should not depend strongly on position.
The second result to come out of the studies by Alton et al. (1998) and Davies et al. (1999) is that the observed scalelength at 200 µm is comparable to or exceeds the scalelength of the optical emission (see also Tuffs et al. 1996). As noted by Alton et al., this result implies that the intrinsic scalelength of the dust in galaxies is greater than that of the stars. This is because the apparent scalelength of stars should increase with increasing disk opacity (since the inner disk is expected to be more opaque than the outer disk) whereas the apparent scalelength of the dust emission will be less than the intrinsic scalelength (due to the decrease in grain temperature with increasing galactocentric radius). The extraction of the precise relation between the intrinsic scalelengths of stars and dust requires a self-consistent calculation of the transfer of radiation through the disk (see Sect. 2.3). The reason for the difference between the intrinsic scalelength of stars and dust in galaxies is not self-evident, since it is the stars themselves which are thought to be the sources of interstellar grains (produced either in the winds of evolved intermediate mass stars or perhaps in supernovae). One might speculate either that there is a mechanism to transport grains from the inner disk to the outer disk, or that the typical lifetimes of grains against destruction by shocks is longer in the outer disk than it is in the inner disk.
While Alton et al. and Davies et al. showed that the scalelength of the 200 µm emission was comparable to or slightly larger than that of the optical emission, these studies did not actually detect grain emission beyond the edge of the optical disk. Since spiral galaxies in the local universe are commonly observed to be embedded in extended disks of neutral hydrogen - the so called "extended HI disks", it is a natural question to ask whether these gaseous disks contain grains. This question was answered in the affirmative by Popescu & Tuffs (2003), through dedicated deep FIR maps of a large field encompassing the entire HI disk of the edge-on spiral galaxy NGC 891, made using ISOPHOT at 170 and 200 µm (see Fig. 3).
 |
Figure 3. The radial profiles of HI emission (from Swaters et al. 1997) convolved with the ISOPHOT PSF (solid line) and of 200 µm FIR emission (symbols) of NGC 891 (Popescu & Tuffs 2003). Note that the extent and asymmetry of the 200 µm emission follow that of the HI emission. The profiles are sampled at intervals of 18". The negative radii correspond to the southern side of the galaxy and the galaxy was scanned at 60 degrees with respect to the major axis. The units of the FIR profile are W/Hz/pixel, multiplied by a factor of 2 × 10-22 and the error bars are smaller than the symbols. The horizontal bar delineates the FWHM of the ISOPHOT PSF of 93". The vertical arrows indicate the maximum extent of the optically emitting disk. The dotted line represents a modified HI profile obtained in the southern side from the original one by cutting off its emission at the edge of the optical disk and by convolving it with the ISOPHOT PSF. |
The large amounts of grains found in the extended HI disk (gas-to-dust ratio of ~ 1%) clearly shows that this gaseous disk is not primordial, left over from the epoch of galaxy formation. It was suggested that the detected grains could have either been transported from the optical disk (via the halo, using mechanisms such as those proposed by Ferrara et al. (1991), Davies et al. (1998), Popescu et al. (2000a) or through the action of macro turbulence) or that they could have been produced outside the galaxy (for example transferred in interactions with other galaxies). It is interesting to note that, although the dust emission is seen towards the HI component, the grains may not actually be embedded in the neutral ISM. Instead, this dust could trace an "unseen" molecular component, as proposed by Pfenniger & Combes (1994), Pfenniger, Combes & Martinet (1994), Gerhard & Silk (1996), and Valentijn & van der Werf 1999b. This cold molecular gas component has been invoked as a dark matter component to explain the flat rotation curves of spiral galaxies. Its presence might also reconcile the apparent discrepancy between the very low metallicities measured in HII regions in the outer disk (Ferguson, Gallagher & Wyse 1998) and the high ratio of dust to gas (on the assumption that all gas is in form of HI) found by Popescu & Tuffs (2003) in the extended HI disk of NGC 891.
2.1.4. The extent of spiral disks in the MIR
As alluded to in the discussion of the MIR aspect of M 31 above, the MIR disks of spiral galaxies are generally quite short. At first glance they can even appear truncated since in the outer region the emission is generally dominated by the HII regions of the arms, superimposed on a very diffuse disk emission. This appearance is however mostly an "optical" illusion. The radial profiles of the exponentially declining MIR disk emission of M 83 Vogler et al. 2004 show a scalelength that is clearly shorter than that seen in any optical bands, but with no truncation. The strong decrease of star-formation activity in the outer regions of galaxies induces a rapid disappearance of the MIR emission, although, as is definitely revealed by long-wavelength observations, dust is still present at large galactocentric distances.
A more systematic study of the extent of MIR spiral disks was presented in Roussel et al. 2001c. These authors have defined a MIR disk diameter, DMIR, in a similar way as the definition used in the optical, by measuring the diameter of the 5 µJy/arcsec-2 isophote at 6.75 µm (this is roughly the detection limit of this band). This definition allows to compare optical and MIR diameters on a broad range of galaxies. It shows that the IR diameter (as defined above) is systematically smaller than the optical one (the largest value of DMIR / Dopt observed in this sample of about 70 galaxies is slightly less than 1, while the smallest value observed is ~ 0.3). The variation of DMIR / Dopt can be related to both the morphological type of the galaxies or their HI deficiency in the sense that earlier type or more severely HI deficient galaxies have a smaller DMIR / Dopt. Roussel et al. 2001c indicate that the HI deficiency is likely the dominant parameter given that HI-deficient galaxies are often classified as early-type galaxies, due to the absence of star-forming regions at large galactocentric distances. The MIR diameter of a galaxy is thus essentially determined by the extent of the star-forming activity through its disk, demonstrating the crucial role of star-formation in powering the MIR emission.
The fact that the MIR disks appear so much smaller than the FIR disks immediately prompts the following question: does the dust responsible for the MIR emission disappear at large galactocentric distances, or phrased differently, should we observe a MIR counterpart to the FIR extended distributions? As mentioned before, ISOCAM was probably less sensitive than ISOPHOT to faint diffuse emission, which would bias the ISOCAM maps toward small-scale bright structures such as the HII regions in the disks. This would explain why MIR emission is not detected far out in the disk, but still leaves open the question of why the scalelength of the MIR emission is so much shorter than that of the FIR emission.
2.1.5. Comparison with morphologies at other wavelengths
Comparison with the optical
Although one immediately associates IR light with dust, the fact that ISO could reach relatively short IR wavelengths prompts the question of the contribution of stars to the shortest ISO bands. And indeed, when studied quantitatively through the use of light concentration indices, as done for instance by Boselli et al. 2003b, the morphology of galaxies at MIR and NIR wavelengths show surprising similarities. This indicates at least a similar spatial distribution of dust and stars, which is not too surprising given the origin of the MIR emission (see later). However, determining the actual contribution of stellar photospheres and circumstellar shells to the ISO fluxes is harder, as it requires first the construction of a pure stellar image and second the correct extrapolation in wavelength of this image to the ISO wavelengths, taking into account the possible stellar population gradients in the galaxy. This type of work led Boselli et al. 2003a to conclude that a large fraction of the 6.75 µm flux in galaxies could be due to stars, ranging from 80% in Sa to 20% in Sc galaxies. This conclusion is however not supported by the analysis of Lu et al. 2003 who showed that already at 6 µm, the mean flux of their galaxies is one order of magnitude larger than what is observed in galaxies devoid of interstellar medium (see Fig. 9). Therefore it appears unlikely that stars make a large contribution to the IR emission of spiral galaxies longwards of 6 µm, even though the spatial distribution of the emission shares some morphological properties with that of the stars, a fact which is due to their common link with the star-formation process.
Comparison with H
For the highly resolved galaxy M 33,
Hippelein et al. (2003)
showed that there is a strong resemblance between the morphology of the
localised warm dust component at 60 µm
(Fl60; obtained at
each direction by subtracting the 170 µm map scaled by the
ratio of the
60 / 170 µm brightness in the interarm regions) and
the morphology of the H
emission (see Fig. 4),
indicating that the 60 µm localised emission traces the
star-formation complexes. The
FH
/ Fl60 ratio (see
Fig. 5) for the star-formation complexes shows a
clear systematic increase with increasing radial distance from the centre
(allowing for the [NII] line contribution decreasing with distance,
the slope would be even steeper). Very probably this is due to the presence
of a larger scale gradient of opacity affecting the recombination line
fluxes.
 |
 |
Figure 4. Left: Distribution of the
localised warm dust component at 60 µm,
Fl60, in M 33
(Hippelein et al 2003).
This is the scaled difference map
2(F60 - 0.165 × F160), with
the factor 0.165 given by the average flux density ratio
F60 / F170 in the interarm
regions. Right:
H |
|
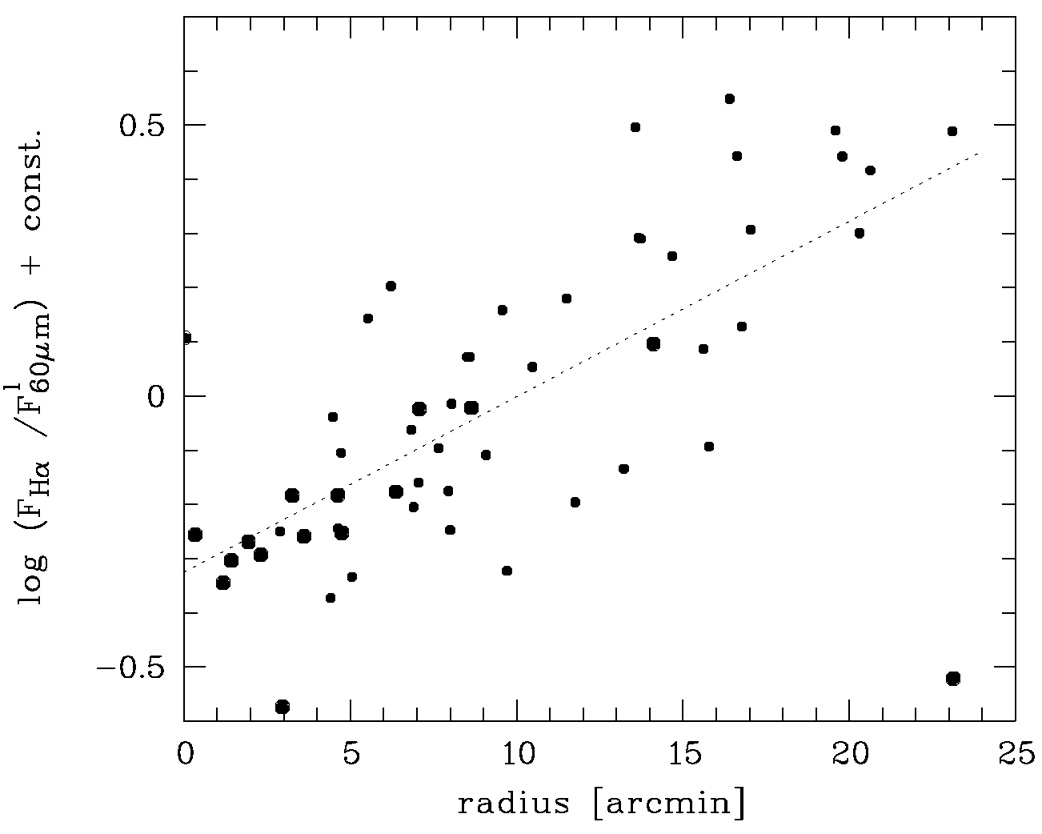 |
Figure 5. The ratio of
FH |
Similarly, in the MIR a number of authors have noted a
striking resemblance between MIR and
H maps of galaxies, which
should not come as a surprise given the numerous links between MIR
emission and star-formation mentioned above. This is both the case for
the well studied galaxies M 51
Sauvage et al. 1996,
NGC 7331
Smith 1998,
M 83
Vogler et al. 2004
and NGC 6946
Walsh et al. 2002
and for larger samples of more distant objects (see for instance
Contursi et
al. 2001 or
Domingue et al. 2003).
However, few authors have studied the
relation between the two emissions within galaxies.
Sauvage et al. 1996
presented a comparison of the MIR /
H ratio for a number of
HII region complexes in M 51. This reveals
that extinction affecting the measure of
H is responsible for most
of the variation observed in the MIR /
H ratio.
One should note that the apparently strong spatial correlation between
the MIR and H maps is
slightly misleading, in the sense that the
limited spatial resolution tends to make the maps more similar than
they really are. Studies of resolved HII regions indeed
show that the MIR emission tends to avoid the peaks of
H emission and rather
delineates the edges of molecular clouds exposed to the radiation
produced by newly-formed stars (see e.g.
Contursi et
al. 1998 or
Contursi et al. 2000
and Fig. 8).
The complexity of the local relation between the MIR emission and
H is revealed by the
studies of
Vogler et al. 2004 and
Walsh et al. 2002.
Using maps at the same resolution, and only taking
independent points, these authors showed that the local
MIR-H correlation is
quite poor and highly non-linear. As we will see, this
is in contrast to the global
MIR-H correlation, which
is linear and tighter. A plausible explanation of this, first introduced
in the context of the FIR emission by
Popescu et al. (2002;
see also
Pierini et al. 2003b),
would be the existence of a diffuse component of the MIR emission from the
underlying disk, powered by the star-formation activity, but
on larger scales than that used by
Walsh et al. 2002 or
Vogler et al. 2004.
Comparison with UV
A fundamental property of spiral galaxies is the fraction of light from young stars which is re-radiated by dust. This property can be investigated as a function of position in the galaxy by a direct comparison of ISOPHOT maps at 60, 100 and 170 µm with UV maps obtained with GALEX (Galaxy Evolution Explorer; Martin et al. 2005) in its near-UV (NUV; 2310Å) and far-UV (FUV; 1530Å) bands. Such a comparison was performed for M 101 by Popescu et al. (2005). The top panels in Fig. 6 display the 100 µm ISOPHOT image (left) together with the corresponding "total UV" (integrated from 1412 to 2718Å) image (right). Comparison between the ratio image (100 µm/UV) (bottom left panel) and an image of the "spiral arm fraction" (the fraction of the UV emission from the spiral arm within an ISOPHOT beam; bottom right panel) shows that the high values of the 100 µm / UV ratio trace the interarm regions. In other words the "spiral features" in the ratio image are in reality regions of diffuse emission which are interspaced with the real spiral features, as seen in the "spiral arm fraction" image.
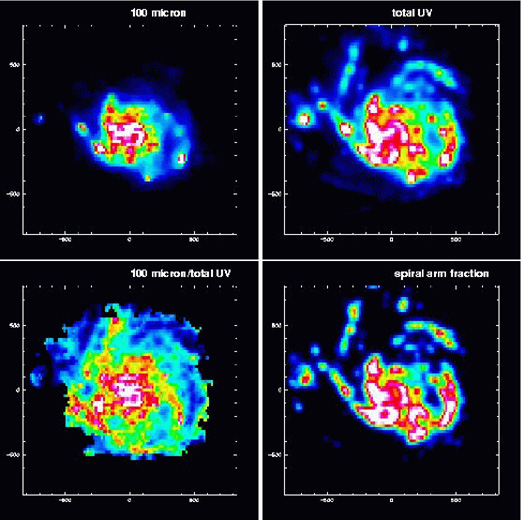 |
Figure 6. FIR-UV comparison for M 101
(Popescu et al. 2005).
Top left panel: filter-integrated 100 µm ISOPHOT image. Top
right panel: "total UV" image converted to the orientation, resolution and
sampling of the 100 µm ISOPHOT image. Bottom left panel: the
ratio image of the filter-integrated 100 µm ISOPHOT image
divided by the corresponding "total UV" image. Bottom right panel:
the image of the "spiral arm fraction" at the orientation,
resolution and sampling of the 100 µm ISOPHOT image. All
panels depict a field of 27.7' × 27.1' centered at
|
The trend for the FIR/UV ratio to be higher in the diffuse interarm regions than in the spiral-arms is seen in Fig. 7 from the segregation of the blue dots and red diamonds at a given radius. This apparently surprising result was explained in terms of the escape probability of UV photons from spiral arms and their subsequent scattering in the interarm regions, and in terms of the larger relative contribution of optical photons to the heating of the dust in the interarm regions. The combined effect of the optical heating and the scattering of the UV emission means that the FIR/UV ratio will not be a good indicator of extinction in the interarm region.
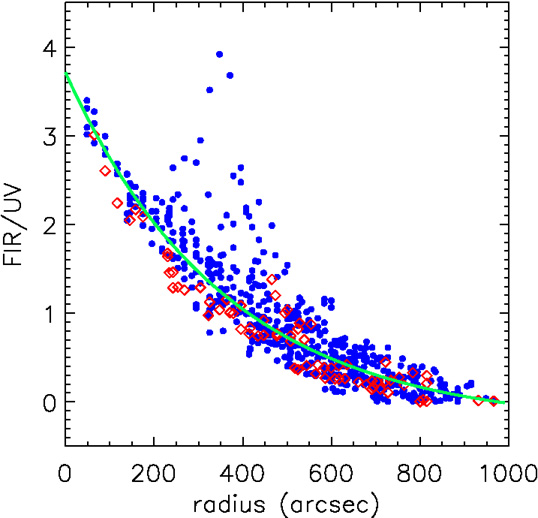 |
Figure 7. The pixel values of the FIR/UV ratio map of M 101 (Popescu et al. 2005) at the resolution of the 170 µm image versus angular radius. The blue dots are for lines of sight towards interarm regions and the red diamonds towards the spiral arm regions. The green solid line is an offset exponential fit to the data. |
Despite these local variations, the main result of Popescu et al. (2005) is the discovery of a tight dependence of the FIR/UV ratio on radius, with values monotonically decreasing from ~ 4 in the nuclear region to nearly zero towards the edge of the optical disk (see Fig. 7). This was interpreted in terms of the presence of a large-scale distribution of diffuse dust having a face-on optical depth which decreases with radius and which dominates over the more localised variations in opacity between the arm and interarm regions.
A comparison of the UV and MIR morphologies, analogous to the UV-FIR
comparison for M 101, has been made for the south-west ring of M 31 by
Pagani et al. 1999.
Here the 20" resolution 200nm map from the
FOCA 1000 balloon experiment is compared to the ~ 6"
resolution 6.75 µm ISOCAM map
(Fig. 8). This study,
and especially its Fig. 8, shows that although
the overall morphology
of the two maps appears similar, following the ring-like structure
observed in that region of the galaxy, the UV and MIR emission
actually complement each other: UV-emitting regions fill the holes in
the distribution of the 6.75 µm emission. In fact, the same
study shows a much tighter spatial correlation of the MIR emission with the
gaseous components (HI or CO) than with the UV
emission. Again, this is interpreted as showing that even if most of the
energy that ultimately powers the MIR emission is generated in the
giant HII region complexes that are seen in
H or UV light, most
of the MIR emission comes from the surfaces of the molecular clouds
that surround these complexes.
 |
Figure 8. The SW ring of M 31 observed by
Pagani et al. 1999.
On the left panel, H |
These differences in the UV and MIR spatial distribution are confirmed
by the recent observations of the Spitzer satellite,
which also reveal that at 24 µm the association between IR
and UV or H emission
becomes tighter, even at high spatial resolution
Helou et al. 2004.
The reason for this will be elucidated in
section 2.2.2.
 -2 are
shown by lines. The dotted line with T = 22K through the IRAS 60 and
100 µm data points indicates what one would extrapolate from
this wavelength range alone without any further assumptions.
-2 are
shown by lines. The dotted line with T = 22K through the IRAS 60 and
100 µm data points indicates what one would extrapolate from
this wavelength range alone without any further assumptions. 2000 =
54°21'06.6". The pixel size is
15.33" × 23.00".
2000 =
54°21'06.6". The pixel size is
15.33" × 23.00".