Copyright © 1998 by Annual Reviews. All rights reserved
| Annu. Rev. Astron. Astrophys. 1998. 36:
435-506 Copyright © 1998 by Annual Reviews. All rights reserved |


Some aspects of the relationship of the stellar populations and the interstellar medium (ISM) in Local Group dwarfs are acutely puzzling. This partly reflects the great detail with which we can now study the ISM in these nearby systems, but it also reflects some fundamental deficiencies in our understanding of dwarf galaxy evolution. In this section, I discuss the basic properties of the ISM in Local Group dwarfs and comment on some of these puzzles. The chemical and kinematic properties of the ISM are discussed in Sections 7 and 8, respectively. Good reviews on the ISM in Local Group dwarfs have been written by Wilson (1994a), Kennicutt (1994), Skillman (1998); a more general review of the ISM in dwarf galaxies can be found by Brinks & Taylor (1994).
4.1. HI Content and Distribution
DIRR GALAXIES
Single-dish and aperture-synthesis radio
observations provide total fluxes (see Table 5)
and detailed HI
maps of many of the dwarfs in the Local Group. Many HI properties show a
clear progression from dIrr to dSph galaxies. For example,
Table 4
shows that the ratios of HI to total masses of dIrr galaxies range from
about 7% to over 50% (SagDIG is anomalous), which is consistent with
expectations from standard closed chemical-enrichment models of
galaxies with low mean abundances (see
Section 7). Four of the five
transition galaxies (denoted dIrr/dSph in
Table 1) have HI-to-total
mass ratios between 1 and 10%. The exception, DDO 210, has a
particularly uncertain distance
(Table 2). The Local Group dSph galaxies are
all comparatively devoid of neutral hydrogen; the few with detectable
emission contain  0.1%
of their mass in the form of interstellar neutral hydrogen.
0.1%
of their mass in the form of interstellar neutral hydrogen.
|
| ||||||||||||||
| Star-formation | ||||||||||||||
|---|---|---|---|---|---|---|---|---|---|---|---|---|---|---|
| Galaxy | S(HI)a | M(HI)b | S(CO)d | Mmole | rateh | f60j | f100k | Md(FIR) l | ||||||
| name | (Jy km s-1) | (106
M ) ) |
Refc | (Jy km s-1) | (106
M) |
Reff |
log(F )g )g |
(M year-1) |
Refi | (mJy) | (mJy) | (102
M) |
Dustm | Refn |
|
| ||||||||||||||
| WLM | 300 ± 25 | 61 ± 6 | 1 | <70 | <1900 | 80 | 6.38 | 0.003 | 2, 3 | 320 | 1,040 | 4.7 ± 0.3 | Yes? | 13, 64 |
| NGC 55 | 2,680 ± 200 | 1,390 ± 224 | 1, 4 | 43 ± 8 | 99 ± 23 | 5, 6 | 7.85 | 0.18 | 7, 8 | 77,000 | 174,090 | 1,050 ± 150 | Yes | 13, 76 |
| IC 10o | 950 ± 140 | 153 ± 35 | 1 | 80 ± 25 | 57 ± 20 | 9, 80 | 8.11 | (0.71) | 2, 10 | 31,230 | 71,250 | 136 ± 12 | Yes | 13–51, 81 |
| NGC 147 | <0.04 | <0.005 | 1, 11, 82 | — | — | — | — | <56 | <160 | 0.34 ± 0.03 | No | 11, 12 | ||
| And III | <0.6 | <0.08 | 1, 14 | — | — | — | — | — | — | — | — | |||
| NGC 185p | 1.4 ± 0.2 | 0.13 ± 0.02 | 1, 11, 82 | 69 ± 15 | 28 ± 6 | 11, 15–17, | 4.47 | 0.0 | 11 | 440 | 1,720 | 5.0 ± 0.3 | Yes | 12, 56 |
| 84 | ||||||||||||||
| NGC 205 | 2.4 ± 0.2 | 0.38 ± 0.04 | 1, 11 | 62 ± 17 | 43 ± 12 | 11, 17, 18, 83 | <1.88 | 0.0 | 11 | 570 | 3,130 | 33 ± 2 | Yes | 12, 68–70 |
| M 32 | <17.8 | <2.7 | 1 | — | — | — | — | <40 | <144 | 0.60 ± 0.04 | No | 12, 19, 79 | ||
| And I | <0.65 | <0.1 | 1, 14 | — | — | — | — | — | — | — | — | |||
| Sculptorq | 17.3 ± 1.5 | 0.026 ± 0.003 | 20, 46 | <2.8 | <0.05 | 46 | — | — | — | — | — | — | ||
| LGS 3r | 2.7 ± 0.1 | 0.42 ± 0.05 | 14, 21, 22 | 28 ± 5 | 19 ± 4 | 23, 31 | <2.10 | 0.0 | 2, 3 | <75 | <109 | <0.1 | — | 13 |
| IC 1613 | 480 ± 40 | 54 ± 11 | 58, 60 | <3.0 | <4.6 | 24, 80 | 6.73 | 0.003 | 2, 25, | 1,420 | 3,690 | 6.3 ± 0.4 | Yes | 12, 13, 63 |
| 26 | ||||||||||||||
| And II | — | — | — | — | — | — | — | — | — | — | ||||
| Phoenix (+55)s | 2.0 ± 0.4 | 0.08 ± 0.02 | 21, 27 | — | — | — | — | — | — | — | — | |||
| Phoenix (-23)s | 2.6 ± 0.1 | 0.11 ± 0.01 | 21, 27 | — | — | — | — | — | — | — | — | |||
| Fornax | <1.05 | <0.005 | 1, 20 | — | — | — | — | <17 | <86 | 0.0 | — | 12 | ||
| EGB 0427+63 | 105 ± 2 | 16 ± 6 | 1 | — | — | 5.40 | 0.0004 | 3 | — | — | — | — | ||
| Carina | <0.29 | <0.0007 | 29 | — | — | — | — | — | — | — | — | |||
| Leo A | 68 ± 3 | 80 ± 8 | 1, 22 | <1.6 | <2.4 | 31, 80, 85, | 4.77 | 0.0003 | 32 | <90 | <270 | <6 | — | 13 |
| 86 | ||||||||||||||
| Sextans B | 106 ± 10 | 45 ± 6 | 1, 60 | <70 | <400 | 80 | 5.58 | 0.0008 | 2, 32 | 246 | 689 | 5.0 ± 0.5 | — | 13 |
| NGC3109 | 1,880 ± 110 | 690 ± 140 | 61, 62 | <1.0 | <4.9 | 33, 80 | 7.08 | 0.02 | 2, 33, | 3,410 | 7,970 | 38 ± 5 | Yes | 13, 52 |
| 57 | ||||||||||||||
| Antliat | 2.7 ± 0.5 | 0.97 ± 0.19 | 34 | — | — | — | — | — | — | — | Yes? | |||
| Leo I | <2.1 | <0.03 | 1, 20 | — | — | — | — | <33 | <72 | 0.0 | No? | 12, 66 | ||
| Sextans A | 160 ± 20 | 78 ± 13 | 1, 35 | <4.1 | <27 | 24, 80, 85 | 5.98 | 0.002 | 2, 36, | 503 | 849 | 3.0 ± 0.3 | — | 13 |
| 78 | ||||||||||||||
| Sextans | <0.08 | <0.0001 | 46 | — | — | — | — | — | — | — | — | |||
| Leo II | <1.05 | <0.01 | 1, 20 | — | — | — | — | — | — | — | — | |||
| GR 8 | 8.4 ± 0.6 | 4.5 ± 1.4 | 22, 59, 60 | <1.6 | <12 | 24, 31, 67 | 5.47 | 0.0007 | 37 | 20 | 143 | 9.2 ± 2.7 | — | 13 |
| Ursa Minor | <42 | <0.04 | 20 | — | — | — | — | <27 | <73 | <0.1 | — | 12 | ||
| Draco | <18 | <0.003 | 20 | — | — | — | — | — | — | — | — | |||
| Sagittariusu | <0.56 | <0.0001 | 38 | — | — | — | — | — | — | — | — | |||
| SagDIG | 33 ± 2 | 8.8 ± 1.9 | 21, 22, 39 | — | — | 4.72 | 0.0001 | 32 | <94 | <204 | <0.6 | 13 | ||
| NGC6822o | 2,370 ± 150 | 134 ± 18 | 1 | 91 ± 17 | 23 ± 5 | 24, 41, 42, | 8.11 | (0.06) | 2, 43 | 47,630 | 95,420 | 52 ± 4 | Yes | 13, 72–75 |
| 47 | ||||||||||||||
| DDO210 | 12.8 ± 1.4 | 1.9 ± 0.8 | 1, 22 | <2.0 | <4.0 | 23, 31, 85 | — | — | 139 | <449 | <4.8 | — | 13 | |
| IC5152 | 98 ± 8 | 59 ± 11 | 1 | <70 | <560 | 80 | — | — | 2,461 | 6,861 | 69 ± 12 | — | 13 | |
| Tucanav | <0.48 | <0.09 | 45 | — | — | — | — | — | — | — | — | |||
| UKS2323-326 | 15 ± 3 | 6.2 ± 2.6 | 1, 39 | — | — | — | — | — | — | — | — | 13 | ||
| Pegasus | 25 ± 2 | 5.4 ± 0.6 | 22, 60 | <2.1 | <6.0 | 23, 31, 80, | 3.80 | 0.0 | 2, 77 | <55 | <531 | <34 | — | 13 |
| 85 | ||||||||||||||
|
| ||||||||||||||
| a Integrated 21-cm flux. | ||||||||||||||
| b Total HI Mass in solar units MHI = 2.36 x 10¹¹ F(HI) d2, where d is the galaxy distance in Mpc and F(HI) in Jy km s-1. | ||||||||||||||
| c HI references: 1, Huchtmeier & Richter 1986; 2, Hunter et al 1993; 3, Hodge & Miller 1995; 4, Hummel et al 1986; 5, Israel et al 1995; 6, Dettmar & Heithausen 1989; 7, Hoopes et al 1996; 8, Ferguson et al 1996; 9, Wilson 1995; 10, Hodge & Lee 1990; 11, Young & Lo 1997a; 12, Knapp et al 1985; 13, Melisse & Israel 1994a, b; 14, Thuan & Martin 1979; 15, Sofue & Wakamatsu 1993; 16, Welch et al 1996; 17, Roberts et al 1991; 18, Sage & Wrobel 1989; 19, van Dokkum & Franx 1995; 20, Knapp et al 1978; 21, Young & Lo 1997b; 22, Lo et al 1993; 23, Young et al 1995; 24, Ohta et al 1993; 25, Hodge et al 1990; 26, Price et al 1990; 27, Carignan et al 1991; 28, deleted in proof; 29, Mould et al 1990; 30, deleted in proof; 31, Tacconi & Young 1987; 32, Strobel et al 1991; 33, Bresolin et al 1993; 34, Fouqué et al 1990; 35, Skillman et al 1988; 36, Hodge et al 1994; 37, Hodge et al 1989; 38, Koribalski et al 1994; 39, Longmore et al 1982; 40, deleted in proof; 41, Israel 1997; 42, Wilson 1994b; 43, Collier & Hodge 1994; 44, deleted in proof; 45, Oosterloo et al 1996; 46, Carignan et al 1998; 47, Wilson 1992b; 48, deleted in proof; 49, Ohta et al 1988; 50, de Vaucouleurs & Ables 1965; 51, Klein & Gräve 1986; 52, Davidge 1993; 53–55, deleted in proof; 56, Hodge 1963b; 57, Hodge 1969a; 58, Lake & Skillman 1989; 59, Carignan et al 1990; 60, Hoffman et al 1996; 61, Jobin & Carignan 1990; 62, Carignan 1985; 63, Hodge 1978; 64, Ables & Ables 1977; 65, Gottesman & Weliachew 1977; 66, Bowen et al 1997; 67, Verter & Hodge 1995; 68, Hodge 1973; 69, Price & Grasdalen 1983; 70, Lee 1996; 71, Hodge 1976; 72, Hodge et al 1991b; 73, Hodge 1977; 74, Wilson 1992a; 75, Gallart et al 1996b; 76, Fitzgibbons 1990; 77, Aparicio & Gallart 1995; 78, Aparicio & Rodríguez-Ulloa 1992; 79, Bendinelli et al 1992; 80, Rowan-Robinson et al 1980; 81, Yang & Skillman 1993; 82, Johnson & Gottesman 1983; 83, Young & Lo 1996b; 84, Wiklind & Rydbeck 1986; 85, Taylor, private communication 1988; 86, Young & Lo 1996a. | ||||||||||||||
d The integrated CO flux, S(CO), in Jy
km s-1. If the CO intensity,
I(CO), is given, I derived S(CO) from the relation S(CO) = g
I(CO), where I(CO) is in K km s-1, and g is a factor
(in Jy K-1)
that accounts for the beam response of a point source. I adopt g
from Roberts et al (1991) or use g = 14.2 or 1.7 for SEST and the
Nobemaya 50m, respectively. When necessary, I assume
S2-1 / S1-0 = 0.75. Upper limits are
3 values and
assume a velocity dispersion of 12 km s-1 if necessary. values and
assume a velocity dispersion of 12 km s-1 if necessary.
| ||||||||||||||
| e Total molecular mass computed as MCO = 1.61 x 10⁴ d2 I(CO) in solar units for d in Mpc (Roberts et al 1991, Wilson 1995). | ||||||||||||||
| f CO references; see footnote c. | ||||||||||||||
| g The base-10 logarithm of the integrated
H flux in units of 10-18
ergs sec-1 cm-2.
| ||||||||||||||
| h The current star formation rate in
M year-1
as prescribed by Kennicutt (1983) using the
extinction-corrected H fluxes.
| ||||||||||||||
| i H
references; see footnote c.
| ||||||||||||||
| j,k The IRAS 60- and 100-µm integrated fluxes, respectively. | ||||||||||||||
| l The total mass of cool dust in solar units: Md = 0.00478 f100 d2[exp(2.94 R0.4) - 1], where R = f100 / f60 and the distance d is in Mpc. If only the 100- µ m fluxes are available, Md = 2.6 f100 d2. Fluxes are in mJy and d is in Mpc (Roberts et al 1991). | ||||||||||||||
| m A flag indicating whether there are optical indicators of dust in the galaxy either through detection of internal reddening or direct observation of opaque dust clouds. | ||||||||||||||
| n Far-infrared (IR) and dust references; see footnote c. | ||||||||||||||
| o Internal reddening is probably
significant. The star-formation rate estimated from the
H flux (along with most
other photometric parameters) may be greatly underestimated.
| ||||||||||||||
| p Young & Lo (1997a) argued that the
H emission is
unlikely to be related to star-formation processes but may instead arise
from shock-excited gas in an old supernova remnant.
Ho et al (1997) classified NGC 185 as a Seyfert 2!
| ||||||||||||||
| q HI emission extended on a scale comparable to the beam size; the HI flux and mass may be significantly underestimated (Carignan et al 1998). | ||||||||||||||
| r The extended HI distribution is much larger than the beam sizes of the earliest observations; the largest reported HI flux is listed here. | ||||||||||||||
| s Young & Lo (1997b)
reported two distinct HI clouds in the vicinity of Phoenix, one at
V = +55,
the other at V.
Results for each cloud
are listed separately. The stellar velocity is not known.
| ||||||||||||||
| t Aparicio et al (1997a) note a possible small HII region near the center of Antlia. This HII region is visible in the color photograph of Whiting et al (1997). | ||||||||||||||
| u HI observations obtained only in fields near the center of the galaxy. | ||||||||||||||
| v
A nearby neutral-hydrogen cloud has F(HI) = 7.7 Jy km s-1 and
V = 130
± 2 Jy Km s-1. Oosterloo et al (1996) favor an
association with the Magellanic Stream rather than Tuscana.
| ||||||||||||||
|
| ||||||||||||||
The spatial distribution of HI emission in most Local Group dIrr galaxies is clumpy on scales of 100-300 pc scales (Shostak & Skillman 1989, Carignan et al 1990, Hodge et al 1991a, b, Lo et al 1993, Young & Lo 1996a, 1997b). Diffuse HI emission is inferred for many galaxies from the large differences in integrated flux from single-dish and synthesis observations. Only the most luminous systems - NGC 3109 and NGC 55 - have comparatively smooth HI distributions (Jobin & Carignan 1990, Puche et al 1991).
The peak emission of individual HI clouds is generally found near regions of optically active star formation, but the clouds are often offset by 50-200 pc from the locations of the nearest star-forming complexes (Gottesman & Weliachew 1977;, Hodge et al 1990, 1991a, b, 1994;, Hodge & Lee 1990). Skillman et al (1988), Saito et al (1992), among others, have suggested that star formation requires a minimum HI column density of about N(HI) ~ 1021 cm-2 to proceed. However, for some galaxies, the peak HI surface density exceeds this limit and yet there is no current or recent star formation (Shostak & Skillman 1989, Young & Lo 1997b). It seems that a trigger is needed to initiate star formation in these cases. There are also counter-examples - mostly in dSph or transition galaxies - where recent or ongoing star formation is apparent, yet N(HI)< 1020 cm-2 (Hodge et al 1991a, b, Lo et al 1993, Young & Lo 1997a, b).
On the largest scales, the HI emission is generally centered on the optical centroids of Local Group dIrr galaxies even systems with complex HI morphology (e.g. Lo et al 1993, Young & Lo 1996a, 1997b; see also Puche & Westpfahl 1994 for examples beyond the Local Group). Transition galaxies are more complicated: The neutral hydrogen in LGS 3 is centered on the optical galaxy, while in Phoenix the HI - if it is in fact associated with the galaxy - is distinctly offset from the optical light (Young & Lo 1997b). In most Local Group dIrr galaxies, the neutral gas is more extended than the optical emission (Hewitt et al 1983, Lake & Skillman 1989, Young & Lo 1996a, 1997b). However, for the two most luminous dIrr systems in the sample (NGC 55 and NGC 3109; Table 4), the surface-brightness profile scale lengths and shapes are similar for the HI emission and optical light (Jobin & Carignan 1990, Puche et al 1991).
Young & Lo (1996,
1997b)
have found evidence that the atomic component of the ISM in Leo A has
two distinct phases. The warm
component has a velocity dispersion of 9 km s-1 and pervades
much of the galaxy, while the cooler component
( ~ 3 km s-1) is found
principally near optical HII regions and contributes 10-20% of the
total HI flux. Remarkably, though, Leo A is 400 times fainter than the
LMC,
both exhibit this two-phase HI structure. The HI gas in NGC 185 and
NGC 205 also seems to exhibit the same two-phase
structure, even though in
these cases the HI is clearly in a nonequilibrium configuration and has
a much lower column density
(Young & Lo 1997a).
EARLY-TYPE DWARFS Deep single-dish HI observations have failed to detect most of the early-type Local Group dwarfs (Knapp et al 1978, Mould et al 1990, Koribalski et al 1994, Oosterloo et al 1996). Knapp et al (1978) detected HI emission near Sculptor, but lacking a precise optical velocity for the galaxy, they tentatively concluded that it was not associated with the galaxy. HI emission has long been known to exist in NGC 185 and NGC 205, but no HI is detected in NGC 147 and M32 to similar limits (Johnson & Gottesman 1983, Huchtmeier & Richter 1986, Young & Lo 1997a; Table 5).
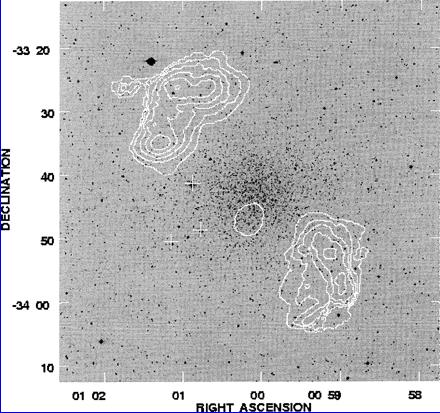
The unique case of Sculptor recently has been revisited by Carignan et al (1998), who found that the emission reported earlier (Knapp et al 1978) is probably associated with Sculptor (the optical velocity is now accurately known; Table 2). Figure 6 is a plot of the HI map and the optical image of Sculptor. The systemic optical and HI velocities agree to within their combined errors (Armandroff & Da Costa 1986, Queloz et al 1995), though there is a hint that the HI velocity may be larger. For NGC 185 and NGC 205, the HI emission is clearly offset spatially and kinematically from the optical counterparts (Young & Lo 1997a, Carignan et al 1998). As in dIrr systems, the HI emission in these two galaxies is also spatially offset from the young stars (Johnson & Gottesman 1983, Young & Lo 1997a).
|
Figure 6. A plot of the Sculptor dSph galaxy showing the optical and 21-cm radio components (Carignan et al 1998). The stellar and HI velocities agree to within 5 km s-1; the gas is almost certainly associated with Sculptor. Considerable HI flux in the outer regions of Sculptor may have been missed by these VLA observations; the actual morphology (total flux) of the HI emitting gas may be quite different (larger) than the bimodal distribution shown (or the flux reported in Table 5). The key point is that what little neutral H gas there is in Sculptor is distributed away from the galaxy's center. For reference, the tidal radius of Sculptor is approximately 76 arcmin (Table 3), slightly larger than the dimensions of the sides of the figure. The HI contours correspond to 0.2, 0.6, 1.0, 1.4, 1.8, and 2.2 x 1019 cm-2. |
Because the extent of Sculptor's HI emission is comparable to the beam size, the map in Figure 6 may be highly incomplete. The actual distribution could be a ring or some other more complex bimodal geometry (Puche & Westpfahl 1994, Young & Lo 1997b). What is certain, however, is that the flux received from the small central HI emission is much less than the flux from the extended component. Because past HI observations of dSph galaxies were centered on the optical image, they could conceivably have missed all of the emission from even a relatively strong extended component. It would be extremely interesting to reexamine the nearby dSph at 21 cm, taking particular care to search for extended HI structures.
4.2. Dust and Molecular Gas
Nearly 25% of the Local Group dwarfs have now been detected in CO emission
(Table 5).
These detections include the lowest luminosity galaxies in which
molecular gas has been observed
(Roberts et al
1991).
The CO
emission is typically confined to distinct clouds with diameters of
50 pc
(Ohta et al 1988,
Saito et al 1992,
Wilson 1995,
Welch et al 1996,
Young & Lo
1997a).
By combining
spectra from fields without direct detections,
Israel (1997) has found
evidence of a diffuse CO component in NGC 6822. Many Local Group dwarfs have
been detected with IRAS at 60 and 100 µm
(Melisse & Isreal
1994a,
b,
Knapp et al 1985).
All of the Local Group IRAS sources either contain
dust and/or a significant population of stars younger than about 10
Myr. Submillimeter observations have also proven useful to tracking dust in
Local Group dwarfs, both from their continuum emission
(e.g. Thronson et al
1990,
Fich & Hodge
1991)
and from carbon line emission (Massen et al 1997).
In general, the spatial and kinematic distribution of dust, CO
emission, HI, and optical star-formation regions are well correlated,
but there are some interesting exceptions.
Hodge & Lee
(1990),
Richer & McCall
(1992),
Welch et al (1996)
found small spatial offsets
between HI and CO emission regions in IC 10, NGC 3109, and NGC 185,
respectively. The locations of optical HII regions often correlate very
well with CO emission regions
(Hodge & Lee
1990,
Saito et al 1992).
However, the CO and H
emission lines are often redshifted relative to HI
(Tomita et al 1993),
which is perhaps indicative of
infall or collapse in the denser regions where CO is observed.
In NGC 185, some regions with strong CO emission appear
devoid of optical dust
(Welch et al 1996),
but when optical dust is present, the regions are usually detected in CO
(Gallagher & Hunter
1981;
IC 1613 may be an exception;
Hodge 1978,
Ohta et al 1993).
Numerous studies have used Local Group dwarfs to measure the conversion
factor, X, between CO emission and H2 molecular mass
as a function of
metallicity. X  NH2 / S(CO), where
NH2 is the
molecular hydrogen column density, and S(CO) is the integrated CO
flux density or intensity. Low-luminosity - hence low-metallicity
(Section 5.2) - dwarfs should have larger
H2-CO conversion factors
because CO formation will be hindered at low abundances for a given
molecular mass. Two methods are used to estimate the molecular masses
needed to calculate X. First, the observed CO line width is taken
as a measure of the cloud velocity dispersion from which the virial
mass is determined (e.g.
Wilson 1994b,
1995).
The second approach
combines IRAS and HI fluxes throughout a galaxy to determine the
total hydrogen column density (neutral plus molecular) where CO is observed
(Israel 1997).
Recent studies all agree that X is higher
for low-luminosity dwarfs, but the precise form, slope, and zero point
of the L-X relation is still controversial
(Ohta et al 1993,
Verter & Hodge
1995,
Wilson 1995).
In NGC 6822 ([Fe/H] ~ - 0.7;
Section 5) X is about two to five times
higher than in the Galaxy
(Ohta et al 1993,
Wilson 1995,
Israel 1997),
while for GR 8 ([O/H] ~ - 1.3),
X
NH2 / S(CO), where
NH2 is the
molecular hydrogen column density, and S(CO) is the integrated CO
flux density or intensity. Low-luminosity - hence low-metallicity
(Section 5.2) - dwarfs should have larger
H2-CO conversion factors
because CO formation will be hindered at low abundances for a given
molecular mass. Two methods are used to estimate the molecular masses
needed to calculate X. First, the observed CO line width is taken
as a measure of the cloud velocity dispersion from which the virial
mass is determined (e.g.
Wilson 1994b,
1995).
The second approach
combines IRAS and HI fluxes throughout a galaxy to determine the
total hydrogen column density (neutral plus molecular) where CO is observed
(Israel 1997).
Recent studies all agree that X is higher
for low-luminosity dwarfs, but the precise form, slope, and zero point
of the L-X relation is still controversial
(Ohta et al 1993,
Verter & Hodge
1995,
Wilson 1995).
In NGC 6822 ([Fe/H] ~ - 0.7;
Section 5) X is about two to five times
higher than in the Galaxy
(Ohta et al 1993,
Wilson 1995,
Israel 1997),
while for GR 8 ([O/H] ~ - 1.3),
X  10 times the Galactic
value
(Ohta et al 1993,
Verter & Hodge
1995).
Ohta et al (1993),
Israel (1997)
both noted that X shows considerable scatter at a given
metallicity, implying that some other parameter affects the
H2-CO ratio.
10 times the Galactic
value
(Ohta et al 1993,
Verter & Hodge
1995).
Ohta et al (1993),
Israel (1997)
both noted that X shows considerable scatter at a given
metallicity, implying that some other parameter affects the
H2-CO ratio.
4.3. HII Regions, Supernova Remnants, and X Rays
The integrated H fluxes of
the Local Group dwarfs are listed in
Table 5. All of the dIrr galaxies in the Local
Group contain HII regions.
Hodge & Lee
(1990)
introduced a
morphological classification scheme for these HII regions;
Hunter et al (1993)
have published deep H
images of many Local Group dwarfs
that provide an excellent way to appreciate this rich morphological
variety. The distribution of morphological types of HII regions
differs between galaxies
(Hodge & Lee
1990,
Hunter et al 1993),
though the size distribution of HII regions is generally well fit as
a power law truncated at a maximum HII region diameter of about
200-400 pc
(Strobel et al 1991,
Hodge et al 1994,
Hodge & Miller 1995).
Only one dSph galaxy (NGC 185) and one transition system (Antlia) have
detected HII emission. The H
emission from NGC 185 appears to be related to an old supernova remnant
(Gallagher et al
1984,
Young & Lo
1997a);
the high excitation led
Ho et al (1995,
1997)
to classify the galaxy as a Seyfert 2. In Antlia, the HII region is
extremely faint
(Aparicio et al
1997a;
the region is visible in the color image of
Whiting et al 1997).
As in Pegasus
(Aparicio & Gallart
1995,
Skillman et al
1997),
its presence may merely reflect the stochastic nature of high-mass star
formation in systems with relatively low average star-formation rates
(Aparicio et al 1997b).
Using radio continuum observations, Yang & Skillman (1993) identified an unusually large nonthermal source in IC 10 that they argued is the remnant of multiple recent supernovae shells. This conclusion received support from the subsequent observations of optical filaments from the radio-continuum shell (Hunter et al 1993). Nonthermal sources have also been observed in IC 1613 and NGC 6822 (Klein & Gräve 1986), which are also probably from old supernova remnants. Virtually all other sources identified in these galaxies are thermal sources associated with optical HII regions or nonthermal background sources.
No diffuse X-ray emission has been detected in any Local Group dwarf (Markert & Donahue 1985, Fabbiano 1989, Gizis et al 1993). This is not surprising: If hot gas was produced during periods of active star formation in any Local Group dwarf, it would have been rapidly expelled from the galaxy and faded to invisibility. The nearby dwarf NGC 1569 appears to be the closest example of a dwarf galaxy experiencing this short-lived X-ray emitting phase (Heckman et al 1995). In general, Local Group dwarfs contain few X-ray sources of any kind, though some possible X-ray binaries have been detected in a few systems (Brandt et al 1997, Eskridge & White 1997, and the references above, but see Eskridge 1995).
4.4. The Interstellar Medium "Crisis" in dSph Galaxies
NGC 147 and NGC 185 are virtually twins; their luminosities, masses, mean abundances, abundance dispersions, average star-formation rates, sizes, and core and exponential radii are extremely similar (Tables 3, 4, 5, 6 and 7). NGC 147 does have a significantly fainter central surface brightness than NGC 185 (Table 3), but the latter contains young stars in its core (see Section 6), which probably boosts its central luminosity density. However, their kinematic properties indicate that both galaxies have very similar central mass densities (Tables 4 and 7). Yet when considering their gaseous component (Table 5), it is immediately apparent that while NGC 185 contains a significant ISM, NGC 147 has none. This is extremely puzzling. Many authors agree that the gas replenishment time scale in galaxies such as these would be approximately 0.1-1 Gyr from internal sources such as planetary nebulae or red giant winds (Ford et al 1977, Mould et al 1990, Gizis et al 1993, Welch et al 1996, Young & Lo 1997a). Paradoxically, NGC 185 contains young stars and even an old supernova remnant (Price 1985, Lee et al 1993b, Young & Lo 1997a), yet this activity has not blown out its gas. Since NGC 147 has no stars younger than 1 Gyr (Han et al 1997), we cannot simply claim that we have caught it just after an energetic star-formation episode that consumed or expelled all of its gas.
|
| ||||||
| Galaxy | [Fe/H]a |
[Fe/H]b |
12 + log (O/H)d | [N/O]e | ||
|---|---|---|---|---|---|---|
| name | (dex) | (dex) | Refc | (dex) | (dex) | Reff |
|
| ||||||
| WLM | -1.5 ± 0.2 | — | 1, 2 | 7.75 ± 0.2 | -1.46 ± 0.15 | 3, 4 |
| NGC 55 | — | — | — | 8.32 ± 0.15 | -1.44 ± 0.15 | 67, 75, 76 |
| IC 10g | — | — | — | 8.19 ± 0.15 | -1.37 ± 0.12 | 5, 74 |
| NGC 147h,i,j | -1.1 ± 0.2 | 0.4 ± 0.1 | 7–9 | — | — | — |
| And III | -2.0 ± 0.2 |  0.2 ± 0.04 0.2 ± 0.04
| 10 | — | — | — |
| NGC 185j,k | -1.22 ± 0.15 | 0.4 ± 0.1 | 11 | 8.2 ± 0.2 | — | 6 |
| NGC 205j,k,l | -0.8 ± 0.1 | 0.5 ± 0.1 | 12–14 | 8.6 ± 0.2 | — | 6 |
| M32l | -1.1 ± 0.2 | 0.7 ± 0.2 | 15, 16 | — | — | — |
| And I | -1.5 ± 0.2 | 0.3 ± 0.1 | 17, 71 | — | — | — |
| Sculptor | -1.8 ± 0.1 | 0.3 ± 0.05 | 18, 19 | — | — | — |
| LGS 3 | -1.8 ± 0.3 | 0.3 ± 0.2 | 20, 65 | — | — | |
| IC 1613 | -1.3 ± 0.2 | — | 2 | 7.8 ± 0.2 | — | 67 |
| And II | -1.6 ± 0.3 | 0.5 ± 0.1 | 21 | — | — | — |
| Phoenix | -1.9 ± 0.1 | 0.5 ± 0.1 | 22, 23 | — | — | — |
| Fornaxj,k | -1.3 ± 0.2 | 0.6 ± 0.1 | 24, 50 | 7.98 ± 0.4 | — | 6, 72 |
| EGB 0427+63 | — | — | — | 7.62 ± 0.1 | -1.5
| 4 |
| Carina | -2.0 ± 0.2 | <0.1 | 51, 52 | — | — | — |
| Leo Ak | — | — | — | 7.3 ± 0.1 | — | 25 |
| Sextans Bm | ~ -1.2 | — | 60 | 7.84 ± 0.3 | — | 25, 26 |
| NGC 3109 | -1.5 ± 0.3 | <0.3 | 2, 28–30 | 8.06 ± 0.2 | — | 6 |
| Antlia | -1.8 ± 0.25 | 0.3 ± 0.1 | 48, 49, 77 | — | — | — |
| Leo I | -1.5 ± 0.4 | 0.3 ± 0.1 | 31, 32, 69, 70 | — | — | — |
| Sextans A | -1.9 ± 0.3 | — | 61 | 7.49 ± 0.2 | — | 25 |
| Sextans | -1.7 ± 0.2 | 0.2 ± 0.05 | 33–36 | — | — | — |
| Leo II | -1.9 ± 0.1 | 0.3 ± 0.1 | 31, 37, 38 | — | — | — |
| GR 8m | — | — | — | 7.62 ± 0.1 | — | 26 |
| Ursa Minor | -2.2 ± 0.1 |
0.2
| 39 | — | — | — |
| Draco | -2.0 ± 0.15 | 0.5 ± 0.1 | 40, 41 | — | — | — |
| Sagittariusj,k,n | -1.0 ± 0.2 | 0.5 ± 0.1 | 54–57, 63, 64 | 8.30 ± 0.08 | -1.0 ± 0.3 | 62 |
| SagDIG | — | — | — | 7.42 ± 0.3 | — | 3 |
| NGC 6822k,m | -1.2 ± 0.3 | 0.5 ± 0.1 | 2, 43, 44 | 8.2 ± 0.2 | -1.7 ± 0.1 | 3, 59, 68 |
| DDO 210o | <-1.0 | — | 30 | — | — | — |
| IC 5152 | — | — | — | 8.36 ± 0.2 | — | 67 |
| Tucana | -1.7 ± 0.15 | 0.3 ± 0.2 | 45, 46 | — | — | — |
| UKS2323-326 | — | — | — | — | — | — |
| Pegasus | -1.0 ± 0.3 | — | 47, 49, 66 | 7.93 ± 0.14 | -1.24 ± 0.15 | 73 |
|
| ||||||
| a The mean iron abundance for the old and
intermediate-age stellar populations where
[Fe/H] log
(Z/Z).
| ||||||
b The intrinsic
dispersion in [Fe/H]. If the reference gave a full metallicity range
instead of a dispersion, I assumed
= 0.5
 [Fe/H]. This
reasonably approximates the scaling between these quantities for the
few galaxies that have independent estimates of both
[Fe/H] and
[Fe/H]. [Fe/H]. This
reasonably approximates the scaling between these quantities for the
few galaxies that have independent estimates of both
[Fe/H] and
[Fe/H].
| ||||||
| c References for the stellar abundances: 1, Minniti & Zijlstra 1996; 2, Lee et al 1993c; 3, Skillman et al 1989b; 4, Hodge & Miller 1995; 5, Garnett 1990; 6, Richer & McCall 1995; 7, Davidge 1994; 8, Mould et al 1983; 9, Han et al 1997; 10, Armandroff et al 1993; 11, Lee et al 1993b; 12, Mould et al 1984; 13, Lee 1996; 14, Richer et al 1984; 15, Davidge & Jones 1992; 16, Grillmair et al 1996; 17, Da Costa et al 1996; 18, Kaluzny et al 1995; 19, Da Costa 1984; 20, Lee 1995a; 21, König et al 1993; 22, van de Rydt et al 1991; 23, Ortolani & Gratton 1988; 24, Beauchamp et al 1995; 25, Skillman et al 1989a; 26, Moles et al 1990; 27, deleted in proof; 28, Lee 1993; 29, Davidge 1993; 30, Greggio et al 1993; 31, Suntzeff et al 1986; 32, Reid & Mould 1991; 33, Suntzeff et al 1993; 34, Mateo et al 1995a; 35, Mateo et al 1991a; 36, Da Costa et al 1991; 37, Demers & Irwin 1993; 38, Lee 1995b; 39, Olszewski & Aaronson 1985; 40, Lehnert et al 1992; 41, Carney & Seitzer 1986; 42, deleted in proof; 43, Gallart et al 1996a; 44, Gallart et al 1996b; 45, Saviane et al 1996; 46, Castellani et al 1996; 47, Aparicio & Gallart 1995; 48, Whiting et al 1997; 49, Aparicio et al 1997b; 50, Buonanno et al 1985; 51, Smecker-Hane et al 1994; 52, Mould & Aaronson 1983; 53, Hurley-Keller et al 1998; 54, Mateo et al 1995c; 55, Ibata et al 1997; 56, Sarajedini & Layden 1995; 57, Da Costa & Armandroff 1995; 58, deleted in proof; 59, Pagel et al 1980; 60, Tosi et al 1991; 61, Dohm-Palmer et al 1997; 62, Walsh et al 1997; 63, Whitelock et al 1996; 64, Marconi et al 1998; 65, Aparicio et al 1997c; 66, deleted in proof; 67, Talent 1980; 68, Dufour & Talent 1980; 69, Lee et al 1993a; 70, Demers et al 1994a; 71, Mould & Kristian 1990; 72, Maran et al 1984; 73, Skillman et al 1997; 74, Lequeux et al 1979; 75, Stasinska et al 1986; 76, Webster & Smith 1983; 77, Sarajedini et al 1997. | ||||||
| d The oxygen abundance defined as 12+log(O/H), where (O/H) is the number ratio of oxygen to hydrogen atoms. | ||||||
| e The nitrogen to oxygen ratio defined as [N/O] = log(N/O), where (N/O) is the number ratio of nitrogen to oxygen atoms. | ||||||
| f References for the oxygen and nitrogen abundances; see footnote c. | ||||||
| g The sulfur abundance was also determined: 12 + log(S/H) = 6.77 (Richer & McCall 1995). | ||||||
| h A weak abundance gradient is seen with [Fe/H] increases with radius from the galaxy center (Han et al 1997). | ||||||
| i The stellar metallicity dispersion is higher in the center of the galaxy than in the outer region (Han et al 1997). | ||||||
| j The globular clusters of this galaxy are more metal poor on average than the field stars. | ||||||
| k The oxygen abundance was derived, at least in part, from one or more planetary nebula. | ||||||
| l The metallicity distribution seems to be skewed towards positive values of [Fe/H] (NGC 205: Mould et al 1984; M32: Grillmair et al 1996). | ||||||
| m The helium abundance, N(He) / N(H), was determined: 0.098 (GR 8; Moles et al 1990); 0.097 (Sextans B; Moles et al 1990); 0.074 (NGC 6822; Pagel et al 1980). | ||||||
| n The associated globular clusters of this galaxy exhibit a considerably larger spread in [Fe/H] than the field stars. | ||||||
| o At the closer distance adopted in Table 2, the stellar iron abundance is likely to be considerably lower than that found by Greggio et al (1993) for their assumed distance of over 2.5 Mpc. | ||||||
|
| ||||||
|
| ||||||||
| Galaxy |
*a |
vrot,*b |
ISMd |
vrot,ISMe | Rrotf | ig | ||
|---|---|---|---|---|---|---|---|---|
| name | (km s-1) | (km s-1) | Refc | (km s-1) | (km s-1) | (arcmin) | (deg) | Refh |
|
| ||||||||
| WLMi,j | — | — | (8) | 21 ± 2 | 4.8 | 69 ± 5 | 1 | |
| NGC 55i–k | — | — | (8) | 86 ± 3 | 21 | 88 ± 2 | 1, 2, 49 | |
| IC 10k | — | — | 8 ± 2 | 30 ± 3 | 13 | 40 ± 5 | 1, 3 | |
| NGC 147 | 22 ± 4 | 6.5 ± 1.1 | 4 | — | — | — | — | |
| And III | — | — | — | — | — | — | ||
| NGC 185l | 25 ± 4 | 1.2 ± 1.1 | 4–8 | — | — | — | — | 7 |
| NGC 205 (Outer)l | 46 ± 8 | 1.5 ± 0.8 | 4, 9–12 | 16 ± 4 | — | — | — | |
| NGC 205 (Inner) | 21 ± 6 | — | 4, 9–12 | — | — | — | — | |
| M32m | 50 ± 10 | 12 ± 3 | 13, 14, 47, | — | — | — | — | |
| 48, 50 | ||||||||
| And I | — | — | — | — | — | — | ||
| Sculptor | 6.6 ± 0.7 | <2.0 | 15–18 | — | — | — | — | |
| LGS 3 | 6.5 ± 3.0 | — | 43 | 9 ± 3 | <2 ± 2 | — | 50 ± 5 | 1, 19, 20 |
| IC 1613k | — | — | 8.5 ± 1.0 | 21 ± 2 | 12.5 | 35 ± 3 | 1, 21, 22 | |
| And II | — | — | — | — | — | — | ||
| Phoenix | — | — | 8.9 ± 1.5 | <2.0 | — | 55 ± 4 | 23 | |
| Fornax | 10.5 ± 1.5 | <2.0 | 24, 25 | — | — | — | — | |
| EGB 0427+63j | — | — | (8) | 33 ± 10 | — | — | 26 | |
| Carina | 6.8 ± 1.6 | — | 27 | — | — | — | — | |
| Leo A | — | — | 9.3/3.5 | <3.0 | — | 45 ± 5 | 1, 19, 28 | |
| Sextans Bj,k | — | — | 18 | 22 ± 3 | 6.6 | 35 ± 15 | 22, 51 | |
| NGC 3109k | — | — | 10 ± 2 | 67 ± 4 | 17.0 | 83 ± 6 | 1, 31, 45 | |
| Antlia | — | — | 6.3 ± 1.7 | — | — | — | 32 | |
| Leo I | 8.8 ± 0.9 | — | 44 | — | — | — | — | |
| Sextans Ai | — | — | 8 ± 3 | 19 ± 2 | 3.7 | 35 ± 3 | 1, 30 | |
| Sextans | 6.6 ± 0.7 | — | 33, 42 | — | — | — | — | |
| Leo II | 6.7 ± 1.1 | — | 34 | — | — | — | — | |
| GR 8n | — | — | 11 ± 3 | 7 ± 3 | 0.5 | 48 ± 3 | 19, 22, 35 | |
| Ursa Minor | 9.3 ± 1.8 | 5.0 ± 2.0 | 36–38 | — | — | — | — | |
| Draco | 9.5 ± 1.6 | <2.0 | 37–39 | — | — | — | — | |
| Sagittarius | 11.4 ± 0.7 | 4.0
| 46 | — | — | — | — | |
| SagDIGo | — | — | 7.5 ± 2.0 | <2.0 | — | 60 ± 10 | 1, 19 | |
| NGC 6822k | — | — | (8) | 47 ± 3 | 19 | 67 ± 3 | 1, 41 | |
| DDO 210 | — | — | 6.6 ± 1.8 | <5.0 | — | — | 19 | |
| IC 5152 | — | — | (8) | 31 ± 3 | 2.6 | 55 ± 5 | 1 | |
| Tucana | — | — | — | — | — | — | ||
| UKS2323-326o | — | — | — | — | — | — | ||
| Pegasus | — | — | 8.6 ± 1.4 | 10 ± 5 | 4.0 | 42 ± 10 | 1, 19, 22 | |
|
| ||||||||
| a The stellar central velocity dispersion. | ||||||||
| b The rotation velocity from stellar velocity measurements. | ||||||||
| c Optical kinematic references: 1, Huchtmeier & Richter 1988; 2, Hummel et al 1986; 3, Shostak & Skillman 1989; 4, Bender et al 1991; 5, Held et al 1992; 6, Welch et al 1996; 7, Young & Lo 1997a; 8, Wiklund & Rydbeck 1986; 9, Carter & Sadler 1990; 10, Held et al 1990; 11, Ford et al 1987; 12, Peterson & Caldwell 1993; 13, Bender & Nieto 1990; 14, Dressler & Richstone 1988; 15, Da Costa 1992; 16, Armandroff & Da Costa 1986; 17, Queloz et al 1995; 18, Da Costa 1994a; 19, Lo et al 1993; 20, Thuan & Martin 1979; 21, Lake & Skillman 1989; 22, Hoffmann et al 1996; 23, Carignan et al 1991; 24, Mateo et al 1991b; 25, Paltoglou & Freeman 1987; 26, Huchtmeier & Richter 1986; 27, Mateo et al 1993; 28, Young & Lo 1996a; 29, deleted in proof; 30, Skillman et al 1988; 31, Jobin & Carignan 1990; 32, Fouqué et al 1990; 33, Suntzeff et al 1993; 34, Vogt et al 1995; 35, Carignan et al 1990; 36, Hargreaves et al 1994b; 37, Olszewski et al 1995; 38, Armandroff et al 1995; 39, Hargreaves et al 1996b; 40, deleted in proof; 41, Gottesman & Weliachew 1977; 42, Hargreaves et al 1994a; 43, KH Cook, EW Olszewski, C Stubbs, private communication; 44, Mateo et al 1998c; 45, Carignan 1985; 46, Ibata et al 1997; 47, Nolthenius & Ford 1986; 48, Tonry 1984; 49, Puche et al 1991; 50, Carter & Jenkins 1993; 51, Hewitt et al 1983. | ||||||||
| d The velocity dispersion measured from the ISM (HI line widths, HI clump-clump dispersions, and CO cloud-cloud dispersions). See footnotes i, j, and o for additional details. | ||||||||
| e The peak or outermost observed rotation velocity of the ISM. | ||||||||
| f The angular distance from the kinematic center of the galaxy to where the rotation velocity listed in column 6 is observed (see footnote e). | ||||||||
| g The inclination of the disk of the galaxy from the plane of the sky. | ||||||||
| h Radio/ISM kinematic references; see footnote c. | ||||||||
| i Formulae given by Huchtmeier &
Richter (1988) to
convert the full width at 20% intensity to FWHM. The rotation velocity
was taken to be FWHM/2.0. If the inferred rotation was found
to be less than 20 km s-1, then the line width was
interpreted instead as a measure of the
internal velocity dispersion such that
0 = FWHM / 2.35.
| ||||||||
| j
ISM is assumed to
be 8 km s-1. No
correction has been applied to vrot for WLM or IC 5152
to account
for this (small) dispersion. For the other galaxies, detailed
corrections for asymmetric drift have been applied to the velocity
curves as necessary in the cited studies.
| ||||||||
| k The higher velocity and spatial resolution study is used here to obtain the rotation velocity. | ||||||||
| l Streaming motions that cannot be attributed to rotation are observed in the HI velocity maps. | ||||||||
| m The nuclear kinematics of M32 are complex, possibly owing to the presence of a massive central black hole (Kormendy & Richstone 1995). The dispersion and rotational velocity quoted here refer to regions far outside the nucleus (r > 10 arcsec). | ||||||||
| n The inner parts appear to follow a solid-body rotation curve, but the outer regions do not exhibit organized rotation and appear to be pressure supported (Carignan et al 1990). | ||||||||
| o Both SagDIG and UKS2323-326 were observed at 21cm by Longmore et al (1982). For SagDIG, their estimate of the velocity dispersion (derived here using the methods described in footnote i above) is highly discrepant compared to the two other independent measurements of the galaxy's dispersion. One of these references (Lo et al 1993) finds no evidence for rotation, so this discrepancy is probably not merely a misinterpretation of the cause for the line broadening. I have chosen to disregard HI velocity widths (of Longmore et al 1982) in this table for both SagDIG (for which other values are available) and UKS2323-326 (for which no other kinematic data are published). | ||||||||
|
| ||||||||
Few early-type Local Group galaxies have been mapped at HI, but most of the
ones that have contain distinct HI clouds with masses ~ 105
M (if at the
distance of the galaxy) and diameters of ~ 200 pc or larger
(Carignan et al 1991,
1998,
Young & Lo
1997a).
This gas is always significantly offset from the optical centers of the
galaxies.
Young & Lo
(1997a)
further emphasize that the configuration and kinematics
of the gas are highly unstable: These HI clouds must be short-lived
structures. As we see in Section 6, most Local
Group dwarfs - including
the early-type systems - have surprisingly complex and varied
star-formation histories. In many cases, there is evidence of star
formation in the past 109 years, yet few seem to contain any gas
that could have fueled this activity (though see
Section 4.1).
If the gas is of internal origin and we have not come onto the scene
just as all dSph systems used up all their gas, then these galaxies
somehow would have had to avoid accumulating any gas between
star-formation episodes (as the lack of central HI and the
NGC 147 / 185 paradox seem to be telling us). Could structures
such as those seen in Sculptor serve as "holding tanks" for such
quasi-expelled gas? Another option is that the gas is of
external origin
(Knapp et al 1985).
This possibility superficially explains the
generally asymmetric distribution of gas in early-type systems (except
LGS 3;
Young & Lo
1997b),
the kinematic offsets of the gas and stars
in these galaxies, and the possibly complex chemical-enrichment history of
at least one dSph system
(Smecker-Hane et al
1994;
accreted clouds
could have any metallicity); it even provides a repository - the
halo - for gas expelled from these galaxies during earlier
episodes. The dIrr galaxies may have less chance to accrete clouds because
they are further from M31 and the Milky Way
(Figure 3).
IC 10 shows evidence of a disturbed outer HI
velocity field and has a
very high current star-formation rate (Table 5;
Shostak & Skillman
1989).
However, these authors warn that many other isolated dIrr systems show
similarly complex kinematics, so such
characteristics do not necessarily imply a recent encounter or merger with
another galaxy or HI cloud. Past surveys for high-latitude HI clouds
would have missed low-velocity clouds under 10 arcmin in diameter and
with M(HI) ~ 105-106
M if located >
50 kpc away
(Wakker & van
Woerden 1997).
The crucial dilemma for any accretion model faces is to
understand how systems with escape velocities as low as 10-15 km
s-1 can snare gas in any quantity within a halo with a
velocity dispersion that is at least 10 times larger.