Copyright © 1998 by Annual Reviews. All rights reserved
| Annu. Rev. Astron. Astrophys. 1998. 36:
435-506 Copyright © 1998 by Annual Reviews. All rights reserved |


In 1971, Paul Hodge wrote an influential review in these volumes devoted to dwarf galaxies. The total dwarf population of the Local Group at that time was 14 galaxies, including the Magellanic Clouds, with six additional uncertain cases. As we see below, the current census of likely dwarf members of the Local Group now stands at 38-2+6. More dwarfs have been confirmed or identified as Local Group members in the past 27 years than during the previous 222 years beginning with Le Gentil's discovery of M32! And it is almost certain that the full census of Local Group dwarfs is not yet complete (Section 2.2).
Merely making a list of Local Group dwarf galaxies demands reliable distances and radial velocities, as well as agreement on the definition of a dwarf galaxy. Table 1 lists all the galaxies that I consider potential Local Group members, without regard to whether they may be dwarf or "giant" galaxies. Also listed are their Hubble types (van den Bergh 1994a), with some modifications and additions for galaxies discovered since that paper. M31, the Milky Way, and M33 are normal "giant" spirals, and I do not consider them in any detail in this review. The Magellanic Clouds - particularly the Small Magellanic Cloud - have a more valid claim to dwarfhood, but I do not discuss them here either. Both have been the subject of recent comprehensive reviews (Olszewski et al 1996b, Westerlund 1990, 1998). All remaining galaxies listed in Table 1 are considered "dwarfs" for the purposes of this review.
2.1. Membership in the Local Group
RESOLVABILITY AND THE BRIGHTEST STARS
A common method of
flagging possible Local Group members is to identify "resolved"
galaxies with low heliocentric velocities. This has been useful to
confirm the proximity of candidate Local Group members; some recent
examples include galaxies studied by
Hoessel et al
(1988;
EGB 0427+63),
Lavery & Mighell
(1992;
Tucana),
and Whiting et al
(1997;
Antlia).
A quantitative variation of this technique is to identify and measure
the brightest red and blue stars in a resolved system
(Sandage 1986b;,
Sandage & Carlson
1982,
1985a,
b,
1988).
Piotto & Capaccioli
(1992),
Rozanski &
Rowan-Robinson (1994)
reassessed this technique, and both concluded
that it is a crude distance indicator
( > 0.5 mag in the
distance modulus) in the optical and the infrared (IR). In contrast,
Karachentsev &
Tikhonov (1993),
Lyo & Lee (1997)
concluded that the systematic uncertainties are considerably
smaller: ~ 0.4 mag in the optical and even smaller in the K band for the
brightest red stars
(Lyo & Lee
1997).
In view of the wide range of star-formation histories exhibited by Local
Group dwarfs (Section 6) and these
contradictory conclusions, the brightest blue and red stars should be
used with care as distance indicators. However, this
approach clearly remains suitable for identifying possible Local Group members
worthy of further study.
> 0.5 mag in the
distance modulus) in the optical and the infrared (IR). In contrast,
Karachentsev &
Tikhonov (1993),
Lyo & Lee (1997)
concluded that the systematic uncertainties are considerably
smaller: ~ 0.4 mag in the optical and even smaller in the K band for the
brightest red stars
(Lyo & Lee
1997).
In view of the wide range of star-formation histories exhibited by Local
Group dwarfs (Section 6) and these
contradictory conclusions, the brightest blue and red stars should be
used with care as distance indicators. However, this
approach clearly remains suitable for identifying possible Local Group members
worthy of further study.
DISTANCES
Table 2 lists the latest information on
distances for all the dwarf members and candidates of the Local Group.
It is satisfying that nearly all of the galaxies listed now have
reasonable distance determinations based on one or more high-precision
distance indicator, including (a) Cepheid variables (e.g.
Madore & Freedman
1991,
Capaccioli et al
1992,
Piotto et al 1994,
Saha et al 1996,
Wilson et al 1996),
(b) the I-band tip of the red giant branch (TRGB) (e.g.
Da Costa & Armandroff
1990,
Lee et al 1993c,
Aparicio 1994,
Aparicio et al
1997b),
(c) RR Lyr stars
(Saha & Hoessel
1990,
Saha et al 1990,
1992a,
b),
(d) SX Phe stars
(McNamara 1995,
Mateo et al 1998b),
and (e) the luminosity of the horizontal branch (HB)
(Ibata et al 1994,
Smecker-Hane et al
1994,
Caputo et al 1995,
Da Costa et al 1996).
Other indicators that serve for more luminous
galaxies such as supernovae, surface brightness fluctuations,
Tully-Fisher (TF), or Dn -
relations
are either inapplicable or remain uncalibrated for very low-luminosity
dwarfs. Since many individual Local Group galaxies have distances determined
with independent techniques, an analysis similar to that of
Huterer
et al (1995) -
which seeks simultaneous consistency of all distance
indicators in all galaxies considered - would be of great interest.
Generally, when two or more groups have studied the same galaxy, the
agreement of CCD-based results is excellent.
|
| ||||||||||
| Galaxy | lb | bc | E(B-V) | (m-M)0 | Distance | Reff |
V ,opt ,opt |
V,radio |
Refi | |
|---|---|---|---|---|---|---|---|---|---|---|
| namea | magd | mage | (kpc) | (km s-1)g | (km s-1)h | |||||
|
| ||||||||||
| WLMj | 75.9 | -73.6 | 0.02 ± 0.01 | 24.83 ± 0.08 | 925 ± 40 | 1–3, 135 | — | -123 ± 3 | 4, 5 | |
| NGC 55j | 332.7 | -75.7 | 0.03 ± 0.02 | 25.85 ± 0.20 | 1480 ± 150 | 8, 9 | — | 124 ± 6 | 4, 8, 136, 137 | |
| IC 10 | 119.0 | -3.3 | 0.87 ± 0.12 | 24.58 ± 0.12 | 825 ± 50 | 10, 11 | -344 ± 5 | -342 ± 6 | 4, 5, 12–14 | |
| NGC 147 | 119.8 | -14.3 | 0.18 ± 0.03 | 24.30 ± 0.12 | 725 ± 45 | 1, 15 | -193 ± 3 | — | 16, 22 | |
| And IIIk | 119.3 | -26.2 | 0.05 ± 0.02 | 24.40 ± 0.10 | 760 ± 40 | 18 | — | — | 4, 19 | |
| NGC 185 | 120.8 | -14.5 | 0.19 ± 0.02 | 23.96 ± 0.08 | 620 ± 25 | 1, 20 | -210 ± 7 | -204 ± 4 | 16, 21–25 | |
| NGC 205l | 120.7 | -21.7 | 0.04 ± 0.02 | 24.56 ± 0.08 | 815 ± 35 | 1, 26, 27 | -242 ± 3 | -229 ± 5 | 4, 16, 22, 29–31, | |
| 138 | ||||||||||
| M32 | 121.2 | -22.0 | 0.08 ± 0.03 | 24.53 ± 0.08 | 805 ± 35 | 32 | -197 ± 3 | — | 4, 34, 157 | |
| M31 | 121.2 | -21.6 | 0.08 | 24.43 | 770 | 159 | -297 | 159 | ||
| And Ik | 121.7 | -24.9 | 0.04 ± 0.02 | 24.53 ± 0.10 | 805 ± 40 | 36, 37 | — | — | 4, 19 | |
| SMC | 302.8 | -44.3 | 0.08 | 18.82 | 58 | 125, 159 | -175 | 159 | ||
| Sculptork,m | 287.5 | -83.2 | 0.02 ± 0.02 | 19.54 ± 0.08 | 79 ± 4 | 39, 40, 145 | 108 ± 3 | 102 ± 5 | 4, 41, 42, 44, | |
| 142 | ||||||||||
| LGS 3 | 126.8 | -40.9 | 0.08 ± 0.03 | 24.54 ± 0.15 | 810 ± 60 | 45, 151–153 | -282 ± 4 | -272 ± 6 | 4, 46, 155 | |
| IC 1613 | 129.8 | -60.6 | 0.03 ± 0.02 | 24.22 ± 0.10 | 700 ± 35 | 1, 27, 47, 48 | -237 ± 5 | -234 ± 3 | 4, 49–51, 156 | |
| And II | 128.9 | -29.2 | 0.08 ± 0.02 | 23.6 ± 0.4 | 525 ± 110 | 52 | — | — | ||
| M33 | 133.6 | -31.3 | 0.08 | 24.62 | 840 | 159 | -181 | 159 | ||
| Phoenixm | 272.2 | -68.9 | 0.02 ± 0.01 | 23.24 ± 0.12 | 445 ± 30 | 53, 55 | — | 56 ± 3/-23 ± 2 | 54, 144 | |
| Fornaxk | 237.1 | -65.7 | 0.03 ± 0.01 | 20.70 ± 0.12 | 138 ± 8 | 56 | 53 ± 3 | — | 4, 57, 142 | |
| EGB 0427+63 | 144.7 | -10.5 | 0.30 ± 0.15 | 25.6 ± 0.7 | 1300 ± 700 | 61, 146, 147 | — | 324 | -87 ± 6 | 4 |
| LMC | 280.5 | -32.9 | 0.06 | 18.45 | 49 | 125, 159 | 159 | |||
| Carinak | 260.1 | -22.2 | 0.04 ± 0.02 | 20.03 ± 0.09 | 101 ± 5 | 63–66, 148 | 224 ± 3 | — | 67–69 | |
| Leo An | 196.9 | +52.4 | 0.01 ± 0.01 | 24.2 ± 0.3 | 690 ± 100 | 70, 141, 161 | — | 26 ± 2 | 4, 5, 46, 139 | |
| Sextans B | 233.2 | +43.8 | 0.01 ± 0.02 | 25.64 ± 0.15 | 1345 ± 100 | 71 | — | 303 ± 2 | 4, 46, 50, 152 | |
| NGC 3109j | 262.1 | +23.1 | 0.04 ± 0.02 | 25.48 ± 0.25 | 1250 ± 165 | 1, 72–75, 143 | — | 404 ± 2 | 4, 76, 77 | |
| Antlia | 263.1 | +22.3 | 0.05 ± 0.03 | 25.46 ± 0.10 | 1235 ± 65 | 78, 79, 158 | — | 361 ± 2 | 80 | |
| Leo Ik | 226.0 | +49.1 | 0.01 ± 0.01 | 21.99 ± 0.20 | 250 ± 30 | 81, 82 | 286 ± 2 | — | 4, 83, 84, 142 | |
| Sextans A | 246.2 | +39.9 | 0.03 ± 0.02 | 25.75 ± 0.15 | 1440 ± 110 | 71, 86 | 328 ± 5 | 325 ± 3 | 4, 49, 87 | |
| Sextansk | 243.5 | +42.3 | 0.03 ± 0.01 | 19.67 ± 0.08 | 86 ± 4 | 88–90 | 227 ± 3 | — | 44, 91–93 | |
| Leo IIk | 220.2 | +67.2 | 0.02 ± 0.01 | 21.63 ± 0.09 | 205 ± 12 | 95–97 | 76 ± 2 | — | 4, 98, 142 | |
| GR 8 | 310.7 | +77.0 | 0.02 ± 0.02 | 26.0 ± 0.7 | 1590 ± 600 | 100–102, 162 | — | 215 ± 3 | 4, 46, 50, 154 | |
| Ursa Minork | 105.0 | +44.8 | 0.03 ± 0.02 | 19.11 ± 0.10 | 66 ± 3 | 103, 104 | -248 ± 2 | — | 105, 106, 142 | |
| Dracok | 86.4 | +34.7 | 0.03 ± 0.01 | 19.58 ± 0.15 | 82 ± 6 | 108, 160 | -293 ± 2 | — | 105, 109, 142 | |
| Milky Way | 0.0 | 0.0 | — | 14.52 | 8 | 125 | — | — | ||
| Sagittariusk,o | 5.6 | -14.1 | 0.15 ± 0.03 | 16.90 ± 0.15 | 24 ± 2 | 111–114, 149 | 140 ± 5 | — | 111, 115, 116, | |
| SagDIG | 21.1 | -16.3 | 0.22 ± 0.06 | 25.2 ± 0.3 | 1060 ± 160 | 117–119 | -75 ± 5 | -79 ± 2 | 4, 119, 144 | |
| NGC 6822j | 25.3 | -18.4 | 0.26 ± 0.04 | 23.45 ± 0.15 | 490 ± 40 | 1, 2 | -53 ± 4 | -54 ± 6 | 4, 49, 121–123, | |
| 136 | ||||||||||
| DDO 210n | 34.0 | -31.3 | 0.06 ± 0.02 | 24.6 ± 0.5 | 800 ± 250 | 120, 124, 125 | — | -137 ± 3 | 4, 5, 46 | |
| IC 5152 | 343.9 | -50.2 | 0.01 ± 0.02 | 26.01 ± 0.25 | 1590 ± 200 | 126, 134 | — | 124 ± 3 | 4, 5 | |
| Tucanap | 322.9 | -47.4 | 0.00 ± 0.02 | 24.73 ± 0.08 | 880 ± 40 | 127–129 | — | — | 132 | |
| UKS2323-326 | 11.9 | -70.9 | 0.07 ± 0.03 | 25.6 ± 0.5 | 1320 ± 350 | 118 | — | 62 ± 6 | 119 | |
| Pegasuso | 94.8 | -43.5 | 0.02 ± 0.01 | 24.90 ± 0.10 | 955 ± 50 | 130, 131, 150 | — | -182 ± 2 | 4, 5, 46, 144 | |
|
| ||||||||||
| aNames in italic are "giant" galaxies, included here for convenience but not discussed in any detail in this review. | ||||||||||
| b, c Galactic longitude and latitude, respectively. | ||||||||||
| d Foreground reddening. | ||||||||||
| e True distance modulus. | ||||||||||
| f Distance/reddening references: 1, Lee et al 1993c; 2, Gallart et al 1996c; 3, Minniti & Zijlstra 1996; 4, Huchtmeier & Richter 1986; 5, Richter et al 1987; 6, Heisler et al 1997; 7, Côté 1995; 8, Puche et al 1991; 9, Pritchett et al 1987; 10, Wilson et al 1996; 11, Saha et al 1996; 12, Saito et al 1992; 13, Wilson & Reid 1991; 14, Shostak & Skillman 1989; 15, Han et al 1997; 16, Bender et al 1991; 18, Armandroff et al 1993; 19, Thuan & Martin 1979; 20, Lee et al 1993b; 21, Held et al 1992; 22, Young & Lo 1997a; 23, Wiklind & Rydbeck 1986; 24, Welch et al 1996; 25, Ford et al 1977; 26, Lee 1996; 27, van den Bergh 1995; 29, Carter & Sadler 1990; 30, Held et al 1990; 31, Peterson & Caldwell 1993; 32, Grillmair et al 1996; 33, deleted in proof; 34, Dressler & Richstone 1988; 36, Da Costa et al 1996; 37, Mould & Kristian 1990; 39, Schweitzer et al 1995; 40, Da Costa 1984; 41, Queloz et al 1995; 42, Armandroff & Da Costa 1986; 44, Carignan et al 1998; 45, Lee 1995b; 46, Lo et al 1993; 47, Saha et al 1992a; 48, Huterer et al 1995; 49, Tomita et al 1993; 50, Hoffman et al 1996; 51, Lake & Skillman 1989; 52, König et al 1993; 53, Ortolani & Gratton 1988; 54, Carignan et al 1991; 55, van de Rydt et al 1991; 56, Beauchamp et al 1995; 57, Mateo et al 1991b; 59, Karachentsev & Tikhonov 1993; 60, deleted in proof; 61, Hoessel et al 1988; 62, deleted in proof; 63, Smecker-Hane et al 1994; 64, Hurley-Keller et al 1998; 65, Mighell 1997; 66, McNamara 1995; 67, Mateo et al 1993; 68, Godwin & Lynden-Bell 1987; 69, Mould et al 1990; 70, Hoessel et al 1994; 71, Piotto et al 1994; 72, Lee 1993; 73, Capaccioli et al 1992; 74, Musella et al 1997; 75, Richer & McCall 1992; 76, Jobin & Carignan 1990; 77, Carignan 1985; 78, Whiting et al 1997; 79, Aparicio et al 1997c; 80, Fouqué et al 1990; 81, Lee et al 1993a; 82, Demers et al 1994a; 83, Mateo et al 1998c; 84, Zaritsky et al 1989; 86, Sakai et al 1996; 87, Skillman et al 1988; 88, Mateo et al 1995a; 89, Mateo et al 1991a; 90, Irwin et al 1990; 91, Hargreaves et al 1994a; 92, Suntzeff et al 1993; 93, Da Costa et al 1991; 95, Mighell & Rich 1996; 96, Demers & Irwin 1993; 97, Lee 1995b; 98, Vogt et al 1995; 100, Tolstoy et al 1995; 101, Wyatt & Dufour 1993; 102, Aparicio et al 1988; 103, Nemec et al 1988; 104, Olszewski & Aaronson 1985; 105, Armandroff et al 1995; 106, Hargreaves et al 1994b; 108, Nemec 1985; 109, Hargreaves et al 1996b; 111, Ibata et al 1994; 112, Mateo et al 1995b; 113, Alard 1996; 114, Alcock et al 1997; 115, Ibata et al 1997; 116, Koribalski et al 1994; 117, Longmore et al 1978; 119, Longmore et al 1982; 120, Marconi et al 1990; 121, Gottesman & Wiliachew 1977; 122, Israel 1997; 123, Wilson 1994b; 124, Greggio et al 1993; 125, van den Bergh 1994a; 126, Caldwell et al 1988; 127, Saviane et al 1996; 128, Da Costa 1994a; 129, Castellani et al 1996; 130, Aparicio 1994; 131, Hoessel et al 1990; 132, Oosterloo et al 1996; 133, Richter et al 1991; 134, Burstein & Heiles 1982; 135, Hodge & Miller 1995; 136, Israel et al 1995; 137, Hummel et al 1986; 138, Sage & Wrobel 1989; 139, Young & Lo 1996a; 140, deleted in proof; 141, Demers et al 1984; 142, Knapp et al 1978; 143, Davidge 1993; 144, Young & Lo 1997b; 145, Kaluzny et al 1995; 146, Karachentseva et al 1996; 147, Karachentsev et al 1994; 148, Mateo et al 1998b; 149, Sarajedini & Layden 1995; 150, Aparicio et al 1997b; 151, Aparicio et al 1997a; 152, Mould 1997; 153, Tikhonov & Makarova 1996; 154, Carignan et al 1990; 155, KH Cook, EW Olszewski, C Stubbs, private communication; 156, Lu et al 1993; 157, Nolthenius & Ford 1986; 158, Sarajedini et al 1997; 159, Karachentsev & Makanov 1996; 160, Grillmair et al 1998; 161, Tolstoy et al 1998; 162, Dohm-Palmer et al 1998. | ||||||||||
| g Heliocentric velocity based on optical measurements. | ||||||||||
| h Heliocentric velocity based on radio measurements. | ||||||||||
| iV elocity references; see footnote f. | ||||||||||
| j Photographic spectra were obtained by Humason et al (1956), from which they measured velocities of -78, 210, and 441 km s-1 for WLM, NGC 55, and NGC 3109, respectively. The typical uncertainty in these results is approximately 50 km s-1. | ||||||||||
| k No HI detected. See Table 5 for limits. | ||||||||||
| l HI, CO, and optical velocities differ by small but possibly significant amounts. | ||||||||||
| m Ambiguous HI detection; the velocity of the most plausible component is listed. For Phoenix, one or both of two HI clouds could be associated with the galaxy (Carignan et al 1991). | ||||||||||
| n Large distance discrepancy or uncertainty; see text. | ||||||||||
| o All values refer to the central regions of the galaxy, taken to coincide with the globular cluster M54. | ||||||||||
| p
A nearby HI cloud
(V
~ 130 km s-1) is observed about 15 arcmin from Tucana, which
may be associated with the Magellanic Stream
(Oosterloo et al 1996).
| ||||||||||
|
| ||||||||||
There are exceptions. Aparicio (1994) used the TRGB method to argue that the distance of the Pegasus dIrr galaxy is considerably closer than the Cepheid-based distance of Hoessel et al (1990). Aparicio noted that many of the putative Cepheids are located on or near the red giant branch (RGB). Wilson (1994a) identified variables in IC 10 that she tentatively claimed might be Cepheids and proposed a surprisingly small distance for the galaxy. Soon afterwards, Wilson et al (1996), Saha et al (1996) obtained IR and optical photometry of bona fide Cepheids in IC 10 to settle the issue, finding good consistency for D ~ 830 kpc. Hoessel et al (1994) identified five possible Cepheids in Leo A, deriving a distance of 2.2 Mpc. This result is inconsistent with the low velocity of Leo A relative to the Local Group barycenter (Figure 1), implies a pathologically large red-to-blue supergiant ratio (Wilson 1992a), forces the HI mass of Leo A to exceed the kinematic mass of the entire galaxy (Section 7), and results in an abnormally low M/L ratio for the galaxy (Young & Lo 1996). Tolstoy et al (1998) have readdressed this problem using new HST and ground-based photometry, and they concluded that Leo A is ~ 0.8 ± 0.2 Mpc away. This result resolves all of the problems noted above for Leo A.
|
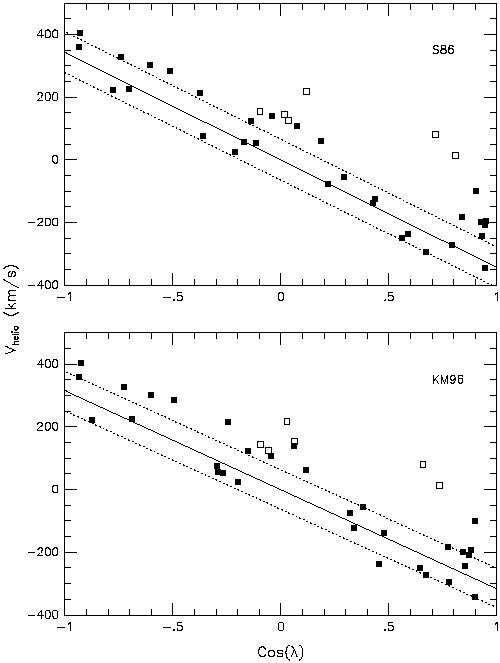
Figure 1.
The heliocentric velocities of nearby
galaxies plotted as a function of
cos( |
Evidently, some dwarf galaxies contain red variables (possibly classical long-period variables or semiregular variables) or other sorts of variables (W Vir stars?) that can mimic classical Cepheids. This underscores the crucial need for color information during searches for variable stars in nearby galaxies, the importance of careful windowing to minimize aliases, and the utility of IR photometry of suspected variables in nearby systems. Given the recent improvements in large optical and IR detectors, this may be a good time to reconsider the Cepheid populations in Local Group dwarfs.
DYNAMICAL CONSIDERATIONS
Yahil et al (1977)
introduced a
dynamical approach that uses only the observed radial velocities to
determine the motions of candidate group members relative to the Local Group
barycenter.
Sandage (1986a)
extended this approach by defining the
zero-velocity surface separating the Local Group from the local Hubble
expansion field. This method acknowledges that the size and internal
dispersion of the Local Group (1.5-2 Mpc in radius and ~ 60 km
s-1,
respectively) imply a crossing time comparable to or longer than a
Hubble time. Thus, some bound Local Group members may not yet have reached the
outer limit of their first orbit and consequently are still
receding from the Local Group center of mass. Sandage's approach
requires an estimate of the Local Group mass. The current consensus for
the mass of the Galaxy has risen since 1986 to about 1.4 ± 0.7 x
1012
M within 200 kpc
from the Galactic Center
(Zaritsky et al
1989,
Fich & Tremaine
1991,
Lin et al 1995,
Peebles 1995,
Kochanek 1996).
If we assume that M31 is 30% more massive than the Milky Way
(Peebles 1989),
the total mass of the Local Group is MLG = 3.3 ±
1.6 x 10¹²
M; the
zero-velocity surface is about 1.8 Mpc from the Local Group barycenter
(Sandage 1986a).
A simple variant of this approach that I use here recognizes that for
a bound system traveling at velocity v along a radial orbit, the
enclosed mass is Menc
 v2 R /
G for a distance R from the
barycenter. For radial orbits, heliocentric velocities can be used to
estimate the mass of the Local Group for each dwarf galaxy with or
without corrections for the Sun's offset from the Local Group barycenter.
Galaxies that imply large values of Menc are probably
not bound to the Local Group and are well into the Hubble flow. Using the
radial velocities compiled in Table 2, I have
calculated Menc for
all Local Group dwarf-galaxy candidates in
Table 1.
Karachentsev (1996)
developed a related method that employs estimates of both the energy and
orbital time scales of individual dwarfs to establish membership.
v2 R /
G for a distance R from the
barycenter. For radial orbits, heliocentric velocities can be used to
estimate the mass of the Local Group for each dwarf galaxy with or
without corrections for the Sun's offset from the Local Group barycenter.
Galaxies that imply large values of Menc are probably
not bound to the Local Group and are well into the Hubble flow. Using the
radial velocities compiled in Table 2, I have
calculated Menc for
all Local Group dwarf-galaxy candidates in
Table 1.
Karachentsev (1996)
developed a related method that employs estimates of both the energy and
orbital time scales of individual dwarfs to establish membership.
The results of this analysis are shown in
Figure 1. Following
Yahil et al (1977),
I plot the heliocentric velocity,
V, vs
cos  for individual Local
Group candidates, where
is the angle between the galaxy and the apex of the solar motion
relative to the Local Group barycenter. The two panels correspond to the
solar-motion solutions of
Sandage (1986a),
Karachentsev &
Makharov (1996;
their equation 4). For the most distant galaxies, the correction from
heliocentric to barycentric velocity
is small. Galaxies for which Menc exceeds the observed
Local Group mass are denoted as open squares. For both
solar-motion solutions, NGC 55 - usually considered a member of the
Sculptor Group - is consistent with Local Group
membership, as are NGC 3109
and the other galaxies near it (see Section 2.3).
EGB 0427+63 and GR 8 are marginal Local Group
members; both galaxies imply
Menc is slightly larger than the adopted Local Group
mass.
for individual Local
Group candidates, where
is the angle between the galaxy and the apex of the solar motion
relative to the Local Group barycenter. The two panels correspond to the
solar-motion solutions of
Sandage (1986a),
Karachentsev &
Makharov (1996;
their equation 4). For the most distant galaxies, the correction from
heliocentric to barycentric velocity
is small. Galaxies for which Menc exceeds the observed
Local Group mass are denoted as open squares. For both
solar-motion solutions, NGC 55 - usually considered a member of the
Sculptor Group - is consistent with Local Group
membership, as are NGC 3109
and the other galaxies near it (see Section 2.3).
EGB 0427+63 and GR 8 are marginal Local Group
members; both galaxies imply
Menc is slightly larger than the adopted Local Group
mass.
Of course, galaxies with large tangential velocities might still be unbound even if their radial velocities relative to the Local Group barycenter are low (Dunn & Laflamme 1993). Proper motions have now been measured (impressively) for some Milky Way satellites: Sculptor (Schweitzer et al 1995), Ursa Minor (AE Schweitzer, KM Cudworth, SR Majewski, in preparation), the Large Magellanic Cloud (LMC) (Jones et al 1994), and Sagittarius (Ibata et al 1997). We can expect to measure the tangential motions of other Local Group galaxies out to ~ 1 Mpc over four- to five-year baselines using HST. For now it is probably not possible to unambiguously determine membership for galaxies near the outer fringe of the Local Group armed with only radial velocities and distances. This is further complicated by the effects that nearby groups must have had on the orbits of galaxies in the outer Local Group (Sandage 1986a, Peebles 1989, 1995).
van den Bergh (1995) suggests that about 98% of the luminous mass of the Local Group has already been identified. But have we identified all of the individual galaxies? Since 50% of the members listed in Table 2 have been found since 1971, the era of discovery within the Local Group probably is not yet over. If we assume that the Local Group galaxy distribution is uniform on the sky (though see Section 2.3), the cumulative number of galaxies should increase from the Galactic poles as 1 -sin |b|, where b is Galactic latitude. Figure 2 shows the cumulative number of all Local Group members (top panel) and MW satellites (bottom panel) as a function of 1 - sin |b|. For comparison, the dotted lines show how a uniformly distributed sample would appear in these diagrams. Note that in both samples, the observed number of galaxies exceeds the predicted distribution at high galactic latitude (small values of 1 -sin|b|). This suggests that many Local Group galaxies remain to be found at low latitudes. If I extrapolate from the observed number of galaxies at the fiftieth and sixty-seventh percentile values of 1 -sin|b|(the vertical lines in Figure 2), as many as 15-20 more Local Group galaxies may be hidden at low latitudes, up to half of which may be satellites of the Milky Way. Using the technique of Yahil et al (1977), Grebel (1997) has identified three to four additional Local Group candidates from the catalog of Schmidt & Boller (1992); none of these have even preliminary distance estimates yet. Karachentseva & Karachentsev (1998) have compiled a list of nearby dwarfs that contain additional candidate Local Group members (also see Karachentsev & Makarov 1998).
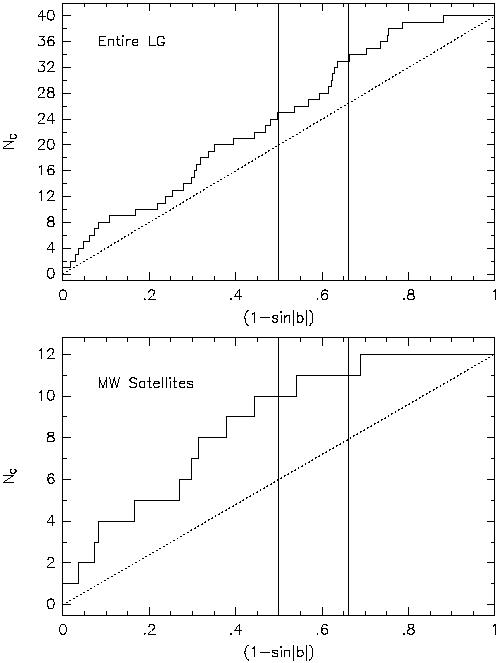
|
Figure 2. Plots of the cumulative distribution of all Local Group galaxies (upper plot) and of the galaxies in the MW subgroup (lower plot) as a function of (1 - sin |b|), where b is Galactic latitude. The dotted lines show the expected distribution of a uniform sample of 40 and 12 objects. The vertical lines show where 50% (left) and 67% (right) of a uniform cumulative distribution would be found. For example, based on the fiftieth percentile value of Nc = 10 in the lower panel, a total of 20 MW satellites would be expected if they were uniformly distributed and if there was no gradient in Galactic extinction as a function of latitude. |
The recent discoveries of Sextans
(Irwin et al 1990)
and Sagittarius
(Ibata et al 1994)
illustrate that nearby galaxies can also hide if they are too diffuse.
Caldwell et al (1998)
recently found a low-surface brightness, but relatively luminous,
dwarf in the M81 group with
0,V = 25.4
mag arcsec-2
and MV = -14.3. If this galaxy - which has a core
radius of 1.6 kpc - were located 1 Mpc from us, it would contribute 22
stars arcmin-2 brighter than I = 22 (corresponding to the
more luminous giants), or only 0.8
stars arcmin-2 brighter than I = 18.5 if located 200 kpc
away. The apparent
core radius would be 5.4 and 27 arcmin, respectively. An object like
this would be difficult to identify even at intermediate Galactic latitude
(Irwin 1994),
though methods designed to find stars far from the centers of
known dwarfs might succeed (e.g.
Gould et al 1992,
Mateo et al 1996,
Kuhn et al 1996,
Siegel et al 1998).
Henning (1997) summarizes prospects for finding "hidden" galaxies from HI observations at low latitudes. Although the Galaxy is transparent at 21 cm, confusion with Galactic emission at low velocities would present a major obstacle to finding Local Group galaxies in this manner. Of course, only gas-rich objects would be found, effectively ruling out detection of gas-poor early-type dwarfs at low latitudes. Ongoing IR surveys such as DENIS (Epchtein et al 1997) and 2MASS (Kirkpatrick et al 1997) may successfully penetrate much of the foreground dust in some regions of the Galactic Plane. Although the stellar density of Galactic field stars would be quite high, the signature of a nearby dwarf galaxy might be possible to detect as a concentrated excess of faint stars at low latitudes.
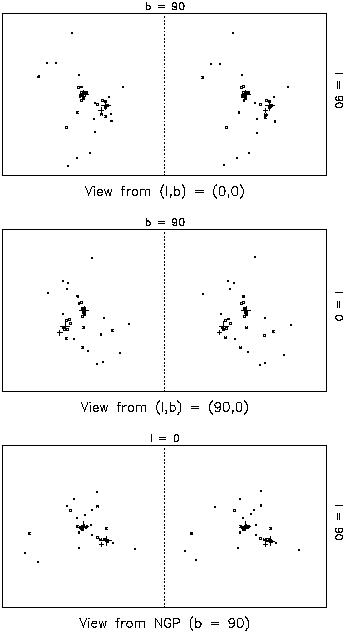
2.3. The Structure of the Local Group
Because they are so numerous, the Local Group dwarfs can be used effectively as tracers of substructure. Gurzadyan et al (1993), Karachentsev (1996) have previously carried out substructure analyses of the Local Group; both found the well-known concentration of galaxies towards M31 and the Milky Way (see also van den Bergh 1995, Grebel 1997). A powerful - but more subjective - way to visualize local substructure is via stereoscopic images of the distribution of Local Group galaxies. Three stereo views are shown in Figure 3a, corresponding to observers located well outside the Local Group along the orthogonal axes (l, b) = (0°, 0°), (90°, 0°), and b = + 90°, centered on the Galactic Center. Figure 3b identifies some of the more distant individual galaxies for each of three viewing positions of
| 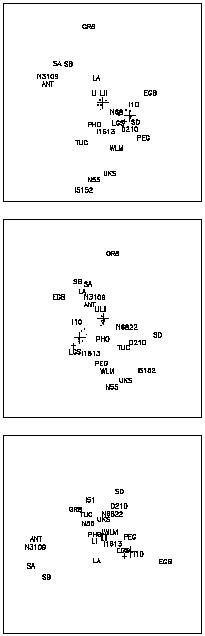
|
Figure 3. Stereoscopic views of the Local Group based on the data in Tables 1 and 2. From top to bottom, these views are from (l, b) = (0°, 0°), (90°, 0°) and the NGP, respectively. The directions of the principle orthogonal axes in the plane of the paper are indicated on the top and right edges of each stereoscopic pair. The "viewer" is located 2.6 Mpc from the center of the Milky Way, which is represented by the large cross closest to the center of each panel; the other large cross represents M31; and the small cross is M33. Open squares represent the dSph and E galaxies (see Table 1 for galaxy types); closed squares are Irr galaxies; small xs are transition systems (denoted dIrr/dSph in Table 1). To produce the stereo effect, the viewer's "eyes" were set about 250 kpc apart. The MW, M31, and NGC 3109 subgroups are easily seen in all three stereo pairs; the Local Group Cloud is best appreciated in the middle pair but is also evident as a distinct structure in the other two panels. Only GR 8 (and possibly Leo A) is unattached to any subgroup; this is best seen in the lower panel where the galaxy is particularly near the observer. The set of three single panels on the opposite page serve to aid identification of individual galaxies in the stereo pairs. The galaxies closest to M31 and the Milky Way have not been labeled to avoid excessive clutter in the diagram. Because of the strong perspective effects required to make a stereo pair, none of the panels represents orthogonal projections of the galaxy positions onto the various planes. | |
Four subgroups are evident in Figure 3. The prominent group located near the center is the Milky Way and its satellites (the origin of the coordinate system is the center of our Galaxy). The second surrounds M31. The third forms an extended "cloud" populated only by dwarfs, mostly dIrr systems. This "Local Group Cloud" is best seen in the middle panel of Figure 3a. The fourth subgroup is relatively isolated and contains NGC 3109 as its most luminous member. The individual members of these four subgroups are identified in Table 1. Remarkably few galaxies have ambiguous subgroup assignments: IC 1613 and Phoenix could both be plausibly placed in the MW or M31 subgroups; Leo A's new distance (Tolstoy 1998) places it in an isolated location between the MW and N3109 subgroups. Only GR 8 - a marginal Local Group member - cannot be clearly assigned to any of these four subgroups.
It is interesting that the N3109 subgroup "points" toward the nearby Maffei / IC 342 group (Karachentsev et al 1996), while the Local Group Cloud very roughly points toward the Sculptor group (Côté et al 1997). NGC 55 is located on the far side of the Local Group Cloud, closest to the Sculptor group. Perhaps the substructure of the Local Group reflects a dynamical history in which the Maffei and Sculptor groups have had an important role and have "stretched out" the Local Group in these directions (Byrd et al 1994). Alternatively, this may reflect a false excess of candidates in these directions where the surface densities of galaxies just beyond the Local Group are relatively high. NGC 55 in particular may be an example of this effect.