


Owing to its proximity, Centaurus A (PKS 1322-427) is the largest
extragalactic radio source in the sky. It extends predominantly in a
north-south direction between declinations
-38.5° 
![]() - 46.5°,
and between right ascensions 13h15
m
- 46.5°,
and between right ascensions 13h15
m ![]() 13h32m
(Fig. 3). Its overall angular dimensions are
8° × 4°
(Cooper et al. 1965;
Haynes et al. 1983;
Junkes et al. 1993;
Combi & Romero 1997).
This translates into a linear
size of 500 × 250 kpc. Although larger radio galaxies have been
found (cf.
Miley 1980),
Centaurus A is still, in an
absolute sense, one of the largest known. Its moderate radio luminosity
places it in class I of the classification by
Fanaroff & Riley
(1974),
suggesting only moderate relavistic beaming effects
(Jones et al. 1994).
For a recent study of the properties distinguishing FR-I and FR-II radio
galaxies, see
Zirbel (1996),
and references therein.
13h32m
(Fig. 3). Its overall angular dimensions are
8° × 4°
(Cooper et al. 1965;
Haynes et al. 1983;
Junkes et al. 1993;
Combi & Romero 1997).
This translates into a linear
size of 500 × 250 kpc. Although larger radio galaxies have been
found (cf.
Miley 1980),
Centaurus A is still, in an
absolute sense, one of the largest known. Its moderate radio luminosity
places it in class I of the classification by
Fanaroff & Riley
(1974),
suggesting only moderate relavistic beaming effects
(Jones et al. 1994).
For a recent study of the properties distinguishing FR-I and FR-II radio
galaxies, see
Zirbel (1996),
and references therein.
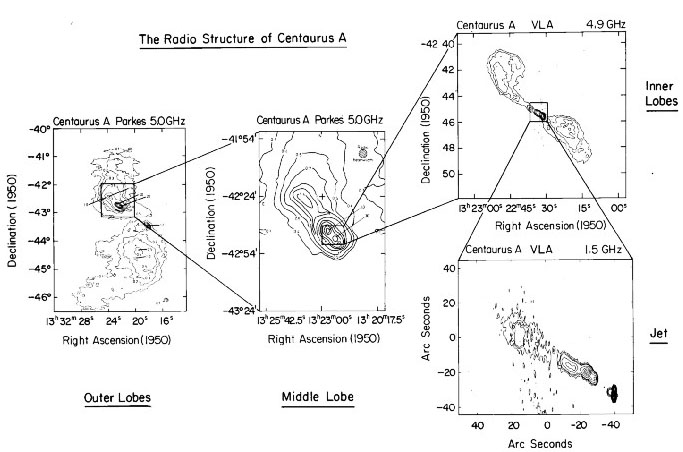
The radio source is very complex; it shows significant structure ranging over a factor of 108 in size from the largest scales down to less than a milli-arcsecond. Major components of the radio source (see Fig. 3) are the giant outer lobes extending to 250 kpc, the northern middle lobe (no southern counterpart) extending to about 30 kpc, the inner lobes and central jets extending to about 5 and 1.35 kpc respectively and the compact core with associated nuclear jets extending over 1 pc (see Fig. 11).
|
Figure 3. Radio maps of Centaurus A, highlighting the various components of the radio source introduced in Sect. 2.1. From Burns et al. (1983). |
Table 2 provides a guide to radio continuum
observations of Centaurus A.
Part A lists radio continuum maps covering the whole source;
integrated flux-densities are not always provided by the authors. Total
source flux-densities between 85 MHz and 4750 MHz define an overall
spectral index
![]() = -0.6
(3)
Part B refers to aperture synthesis radio
maps of the bright inner part which comprises the inner lobes, jets and
core,
and single-dish maps at very high frequencies. References to other early
single-dish maps and flux-densities at various frequencies can be found in
Slee et al. (1983) and
Tateyama & Strauss
(1992).
Part C, finally,
summarizes radio images and flux-densities of the nuclear source. Very
high resolution (VLBI) observations have shown a complex structure even
for the inner few parsec which is further discussed in
Sect. 5.4. Here,
we draw attention to the high-frequency variability of the source
which is clear from the Table and which is further discussed in
Sect. 5.6.
= -0.6
(3)
Part B refers to aperture synthesis radio
maps of the bright inner part which comprises the inner lobes, jets and
core,
and single-dish maps at very high frequencies. References to other early
single-dish maps and flux-densities at various frequencies can be found in
Slee et al. (1983) and
Tateyama & Strauss
(1992).
Part C, finally,
summarizes radio images and flux-densities of the nuclear source. Very
high resolution (VLBI) observations have shown a complex structure even
for the inner few parsec which is further discussed in
Sect. 5.4. Here,
we draw attention to the high-frequency variability of the source
which is clear from the Table and which is further discussed in
Sect. 5.6.
| Reference | Frequency | Resolution | Total Flux |
| (MHz) | (Jy) | ||
| A. Whole Source | |||
| Shain (1958) | 20 | 28000 | |
| Sheridan (1958) | 85 | a7400 | |
| Cooper et al. (1965) | 406 | 48' | 2710 |
| Haslam et al. (1981) | 408 | 48' | |
| Bolton & Clark (1960) | 960 | 20' | a1675 |
| Cooper et al. (1965) | 1410 | 14' | 1330 |
| Combi & Romero (1997) | 1435 | 30' | |
| Cooper et al. (1965) | 2650 | 7.4' | |
| Junkes et al. (1993) | 4750 | 4.3' | 681 |
| Haynes et al. (1983) | 5000 | 4.1' | |
| B. Inner Lobes & Core | |||
| Slee et al. (1983) | 327 | 55" | 734 |
| Slee et al. (1983) | 843 | 40" × 60" | 392 |
| Christiansen et al. (1977) | 1415 | 50" × 45" | 215 |
| Clarke et al. (1992) | 1446 | 4.5" × 1.2" | 78.3 |
| Clarke et al. (1992) | 1634 | 4.5" × 1.2" | 63.5 |
| Clarke et al. (1992) | 4866 | 4.5" × 1.2" | 37.5 |
| Tateyama & Strauss (1992) | 22000 | 258" | 51.2 |
| Tateyama & Strauss (1992) | 43000 | 132" | 31.2 |
| C. Nucleus & Nuclear Jet | |||
| Slee et al. (1983) | 327 | 55" | 2: |
| Slee et al. (1983) | 843 | 40" × 60" | 3: |
| Schreier et al. (1981) | 1407 | 31" × 9.5" | 3.4 |
| Clarke et al. (1992) | 1446 | 4.5" × 1.2" | 3.7 |
| Clarke et al. (1992) | 1634 | 4.5" × 1.2" | 4.9 |
| Jones et al. (1994) | 2300 | 0.1" | 3.4 |
| Schreier et al. (1981) | 4866 | 31" × 9.5" | 5.1 |
| Clarke et al. (1992) | 4866 | 1.1" × 0.3" | 6.9 |
| Jones et al. (1994) | 8400 | 0.03" | 5.9 |
| Clarke et al. (1992) | 14984 | 0.44" × 0.14" | 9.4 |
| Botti & Abraham (1993) | 22000 | 252" | b16-32 |
| Fogarty & Schuch (1975) | 22000 | 252" | 21.5 |
| Kellerman (1974) | 31500 | 225" | 24 |
| Tateyama & Strauss (1992) | 43000 | 132" | 10.8 |
| Botti & Abraham (1993) | 43000 | 132" | b7-20 |
| Kellerman (1974) | 89000 | 80" | 18 |
| Israel (unpublished) | 89000 | 57" | c8 |
| Israel (unpublished) | 110000 | 47" | c7 |
| Israel (unpublished) | 145000 | 36" | c6 |
| Notes: a. As revised by Cooper et al. (1965); b. Range of variation over period 1979 - 1992; c. Measurements in September 1996. | |||
The whole radio source has been mapped with single-dish telescopes only, at linear resolutions no better than 4 kpc. The radio-bright inner lobes have been mapped with aperture synthesis telescopes at hundredfold higher resolutions of about 40 pc and the inner jets and core have been mapped at (sub)parsec resolutions in VLBI experiments. Aperture synthesis mosaicing of the outer features at substantially higher linear resolutions should be undertaken. Although a daunting task in view of the large angular sizes and low surface brightnesses, it is of great importance as no other radio galaxy allows its lobe structures to be studied in the detail possible in the case of Centaurus A.
2.2. The outer and middle lobes
The overall distribution of radio emission is roughly S-shaped. The
distribution of radio emission across the northern and southern outer
lobes is very asymmetric. The brightest part of the giant northern
lobe is
usually called the northern middle lobe; there is no such feature in
the giant southern lobe for reasons that are not understood. One of the
dwarf companion galaxies, UKS 1324-412 = ESO 324-G024, is seen in
projection against the centre of the giant northern lobe. The isolated
radio peak at
![]() =
13h18m,
=
13h18m, ![]() =
-43°26' (Fig. 4) is not part
of the southern lobe, but is due to a 15 mag background elliptical radio
galaxy
(Cooper et al. 1965;
Haynes et al. 1983).
This galaxy could be used as a tracer for conditions in the lobe
(Junkes et al. 1993).
Another unrelated dwarf galaxy, somewhat misleadingly known as the
Fourcade-Figueroa Shred, is located at the tip of the southern main lobe
(Dottori & Fourcade
1973).
While radio surface brightnesses steadily decline away from the core in
the northern
lobe, they reach a maximum in the southern lobe at 1.8° from the core.
The position angle of the northern lobe is close to 0°,
while the southern outer lobe is displaced to the west and has a position
angle of roughly 135°. The two lobes are connected by a low surface
brightness "bridge" and the northern lobe is probably closer to us than the
southern lobe
(Junkes et al. 1993).
Most of the emission from the lobes has a spectral index
-0.5
=
-43°26' (Fig. 4) is not part
of the southern lobe, but is due to a 15 mag background elliptical radio
galaxy
(Cooper et al. 1965;
Haynes et al. 1983).
This galaxy could be used as a tracer for conditions in the lobe
(Junkes et al. 1993).
Another unrelated dwarf galaxy, somewhat misleadingly known as the
Fourcade-Figueroa Shred, is located at the tip of the southern main lobe
(Dottori & Fourcade
1973).
While radio surface brightnesses steadily decline away from the core in
the northern
lobe, they reach a maximum in the southern lobe at 1.8° from the core.
The position angle of the northern lobe is close to 0°,
while the southern outer lobe is displaced to the west and has a position
angle of roughly 135°. The two lobes are connected by a low surface
brightness "bridge" and the northern lobe is probably closer to us than the
southern lobe
(Junkes et al. 1993).
Most of the emission from the lobes has a spectral index
-0.5 ![]() - 0.7,
characterized by a ratio of random to uniform magnetic field strength
Br / B0 = 0.6
(Combi & Romero 1997).
The outer lobes may be associated with hard X-ray limb brightening
(Arp 1994).
- 0.7,
characterized by a ratio of random to uniform magnetic field strength
Br / B0 = 0.6
(Combi & Romero 1997).
The outer lobes may be associated with hard X-ray limb brightening
(Arp 1994).
|
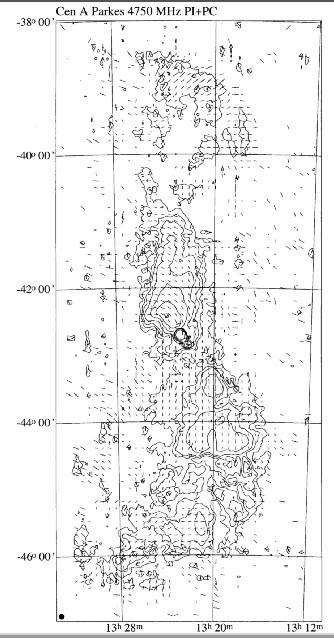
Figure 4. Radio map of Centaurus A at 4.75 GHz. Contours reach from 50 to 40000 mJy/beam area; HPBW beam size is 4.3'. E-vectors, marked for polarized intensities between 25 and 250 mJy/beam area, indicate both intensity and direction of polarization. The map shows the extent of the outer and middle lobes discussed in Sect. 2.2. The inner lobes and jets, discussed in Sects. 2.3 and 2.4 are represented by the barely resolved strong double source in the centre. From Junkes et al. (1993). |
The northern middle lobe is a major feature of the radio source:
at 5 GHz it contributes almost 45% to the total radio emission from
Centaurus A. Its overall orientation is north-south at
13h23m.5 and it fades into
the outer lobe at about ![]() = -41°30'. Its
radio peak is at a projected distance of 20 kpc to the nucleus, at position
angle 36°
(Haynes et al. 1983).
Whereas its radio intensities
drop rather gently towards the north and northwest, its southeastern
edge is relatively sharply delineated. The middle lobe is associated
with soft X-ray emission, with a luminosity of about 5 ×
1039 erg s-1
(Feigelson et al. 1981).
Although inverse Compton scattering of the microwave
background a priori is expected to occur in extended radio lobes, this
explanation does not seem to fit the X-ray emission from this lobe
(Feigelson et al. 1981;
Marshall & Clark
1981;
Morini et al. 1989).
High-resolution
radio observations - not yet existing - might enable a choice to be made
between the remaining explanations of thermal and synchrotron emission.
= -41°30'. Its
radio peak is at a projected distance of 20 kpc to the nucleus, at position
angle 36°
(Haynes et al. 1983).
Whereas its radio intensities
drop rather gently towards the north and northwest, its southeastern
edge is relatively sharply delineated. The middle lobe is associated
with soft X-ray emission, with a luminosity of about 5 ×
1039 erg s-1
(Feigelson et al. 1981).
Although inverse Compton scattering of the microwave
background a priori is expected to occur in extended radio lobes, this
explanation does not seem to fit the X-ray emission from this lobe
(Feigelson et al. 1981;
Marshall & Clark
1981;
Morini et al. 1989).
High-resolution
radio observations - not yet existing - might enable a choice to be made
between the remaining explanations of thermal and synchrotron emission.
The polarization E-vectors (perpendicular to the magnetic field direction)
are well-aligned, but change their direction with increasing right ascension
across the middle lobe from position angle ![]() 15° to
90°, emphasizing its concave southeastern boundary
(Fig. 4;
Junkes et al. (1993).
Polarized intensities are between 20% and 40%, and the
polarization from the middle lobe continues smoothly into that of the
northern outer lobe where peak polarized intensities reach somewhat higher
levels of up to 50% . The southern outer lobe has polarized intensity
levels similar to those in the north, but south of
15° to
90°, emphasizing its concave southeastern boundary
(Fig. 4;
Junkes et al. (1993).
Polarized intensities are between 20% and 40%, and the
polarization from the middle lobe continues smoothly into that of the
northern outer lobe where peak polarized intensities reach somewhat higher
levels of up to 50% . The southern outer lobe has polarized intensity
levels similar to those in the north, but south of ![]() = -44°30' its
polarization structure abruptly becomes very chaotic. This could be due
either to turbulence in the southern lobe, or to the presence of
Galactic foreground polarization.
Junkes et al. (1993)
entertained the possibility that the giant
northern lobe is bending into our line of sight, while the southern lobe
may be turning away from the plane of the sky in the opposite direction.
= -44°30' its
polarization structure abruptly becomes very chaotic. This could be due
either to turbulence in the southern lobe, or to the presence of
Galactic foreground polarization.
Junkes et al. (1993)
entertained the possibility that the giant
northern lobe is bending into our line of sight, while the southern lobe
may be turning away from the plane of the sky in the opposite direction.
In both lobes, steeper spectra are found where the radio surface brightness declines to low levels (see Fig. 4). These steep-spectrum regions appear to be unpolarized, but this may merely reflect a lack of sensitivity (Combi & Romero 1997; Junkes et al. 1993).
2.3. The inner lobes and outer jet
The two inner lobes (cf. Fig. 3) together
contribute almost 30% to the
total 5 GHz flux-density of Centaurus A. The radio emission from the
northern
inner lobe is about 40% higher than that from the southern inner lobe.
Slee et al. (1983)
show that both lobes have identical nonthermal spectral indices
![]() = -0.7, and estimate from this an age of 6 ×
108 years.
= -0.7, and estimate from this an age of 6 ×
108 years.
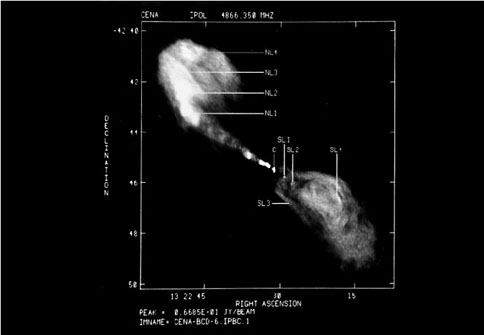
With a maximum angular size of 12', the inner lobes are usually not, or poorly, resolved by single-dish telescopes. Aperture synthesis maps (Fig. 5) reveal pronounced filamentary structure especially in the southern lobe, probably generated by velocity shear in the turbulent flow of the lobe rather than by shocks (Clarke et al. 1992). The northern lobe has a fairly sharply delineated southeastern edge. At the same position angle as the inner lobes, Arp (1994) has found a jet of diffuse X-ray emission, extending, however, much beyond northern radio lobe limits. Its nature and origin are not clear. No soft X-ray emission is seen towards the inner lobes (Feigelson et al. (1981).
|
Figure 5. Gray scale 5 GHz image of the inner lobes and jets of Centaurus A at a resolution of 4.4 × 1.2 arcsec. The gray scales range linearly from -3.0 mJy per beam (dark) to 35.0 mJy per beam (light). The labelled features are discussed in Clarke et al. (1992). Courtesy J. Burns, Univ. of Missouri-Columbia). |
In the high-resolution maps shown by Clarke et al. (1992), the inner lobes are revealed as subsonic plumes emanating from a supersonic central jet at a position angle of 51°. The jet-lobe transition occurs at the location of the innermost optical shell identified by Malin et al. (1983) and marked No. 9 in Fig. 7. This transition has been interpreted as evidence for shock disruption of the jet at the interface of the interstellar and intergalactic medium of the galaxy (Norman et al. 1988; Gopal-Krishna & Saripalli 1984).
The northern jet is quite pronounced and shows several knots, whereas the
southern (counter)jet was first surmised from the detection of a few weak
knots in the southern lobe
(Clarke et al. 1986;
1992);
it is now confirmed by VLBI images
(Sect. 5.4). The direction of
polarization in the inner lobes
is dramatically different from that in the middle and outer
lobes. Beyond the
sharply delineated northern plume perimeter, at a projected distance of 6.3
kpc to the nucleus, it changes abruptly by 90°, so that the northern
inner lobe is quite distinct from the middle lobe. E-vector alignments
indicate a magnetic field emanating radially from the nucleus along the
lobe axis; at the edges of both lobes, the magnetic field is parallel to
the plume perimeter
(Clarke et al. 1992).
At 5 GHz, both lobes are ![]() 35%
polarized with some regions having polarizations as low as 15% or as
high as
50%. The southern lobe is more strongly depolarized, most likely because it
is located behind the clumpy interstellar medium of the galaxy's disk
component (Sect. 4). It exhibits a much less
ordered polarization pattern
(Clarke et al. 1992;
Junkes et al. 1993).
35%
polarized with some regions having polarizations as low as 15% or as
high as
50%. The southern lobe is more strongly depolarized, most likely because it
is located behind the clumpy interstellar medium of the galaxy's disk
component (Sect. 4). It exhibits a much less
ordered polarization pattern
(Clarke et al. 1992;
Junkes et al. 1993).
Broad-line high excitation gas appears to be associated with the inner lobes, but its nature is still unclear (Phillips et al. 1984 and references therein).
The morphologies of the inner radio jet
(Schreier et al. 1981)
and the X-ray jet
(Schreier et al. 1979;
Feigelson et al. 1981;
Döbereiner et
al. 1996;
Turner et al. 1997)
are very similar. They fill the gap between the
nucleus and the optical filaments reported by Dufour & van den Bergh
(1978
- Sect. 2.5). Seven major concentrations (usually
labelled A through G following
Feigelson et al. 1981)
can be discerned with rather identical
radio/X-ray flux ratios. The knots are brightest nearest the nucleus and
are separated by typically 30". They have 0.4-4.5 keV X-ray
luminosities of 0.2-1.0 × 1039 erg s-1. Once
again, it appears that inverse
Compton radiation cannot explain their nature, although both thermal and
synchrotron models are possible
(Feigelson et al. 1981;
see also
Turner et al. 1997).
The kinetic energy of the jet averaged over time exceeds the radiative
energy of the nucleus. It has been suggested that both radio and X-ray
emission are produced by a single population of relativistic electrons with
Lorentz factors
![]()
![]() 8 × 10⁷ in 60 microgauss magnetic
fields
(Schreier et al. 1981;
Burns et al. 1983).
As such electrons have
lifetimes of 50 years or less, in any event much shorter than light travel
times even across the knots, this requires in situ acceleration
(Schreier et al. 1981;
Feigelson et al. 1981;
Burns et al. 1983;
Turner et al. 1997).
There is no evidence for X-ray flux variations of the inner jet
(Döbereiner et
al. 1996;
Turner et al. 1997),
in contrast to the nuclear jet (see
Sect. 5.6).
8 × 10⁷ in 60 microgauss magnetic
fields
(Schreier et al. 1981;
Burns et al. 1983).
As such electrons have
lifetimes of 50 years or less, in any event much shorter than light travel
times even across the knots, this requires in situ acceleration
(Schreier et al. 1981;
Feigelson et al. 1981;
Burns et al. 1983;
Turner et al. 1997).
There is no evidence for X-ray flux variations of the inner jet
(Döbereiner et
al. 1996;
Turner et al. 1997),
in contrast to the nuclear jet (see
Sect. 5.6).
High resolution radio images (18 × 5 pc) by Clarke et al.
(1986;
1992)
illustrate the extremely inhomogeneous nature of the main (northern) jet,
with a hierarchy of knots reaching down to sizes less than 2.5 pc. The jet
is not a linear structure, but exhibits side-to-side limb brightening,
perhaps due to a combination of external and internal shocks
(Clarke et al. 1986).
As most of the jet is inside the main body of the galaxy, some degree
of interaction with the gaseous medium of the galaxy is to be expected.
Indeed,
Burns et al. (1983)
suggested that the inner jet is confined by
external pressure. In the knots, the spectral index decreases from
![]() = - 0.7 at the limb-brightened side to
= - 0.7 at the limb-brightened side to
![]() = - 1.4 at the
diffuse side, while polarized fractions drop from 40% to less than 20% .
Filaments or streamers connect knot complexes to ones downstream; they have
steep spectra
= - 1.4 at the
diffuse side, while polarized fractions drop from 40% to less than 20% .
Filaments or streamers connect knot complexes to ones downstream; they have
steep spectra
![]() = - 1.4. If the knots are shock fronts reaccelerating
electrons, the streamers will represent material flowing down the jet away
from these fronts at speeds of 5000
km s-1; the spectral steepening reflects
increasing importance of synchrotron energy losses
(Burns et al. 1983;
Clarke et al. 1986).
= - 1.4. If the knots are shock fronts reaccelerating
electrons, the streamers will represent material flowing down the jet away
from these fronts at speeds of 5000
km s-1; the spectral steepening reflects
increasing importance of synchrotron energy losses
(Burns et al. 1983;
Clarke et al. 1986).
Intense optical emission from the knots in the brightest part of the X-ray/radio jet, at 0.25'-1.0', and also from in between the knots, was discovered by Brodie et al. (1983). The emission is due to gas at densities of a few hundred per cc in the knots, and from gas at less than 10 per cc in the interknot region. At least one of the optical features corresponds precisely to radio/X-ray structure suggesting shock excitation of clumps carried along in the jet flow. The continuum appears to be the optical counterpart of the synchrotron X-ray/radio emission (Brodie & Bowyer 1985).
Somewhat farther out, a long chain of filaments, dust clouds, H![]() knots
and blue stellar objects emanates from the centre of the galaxy more or
less along the direction of the jet. This chain starts at about 2' from the
nucleus and extends out to 28' (see the review by
Danziger 1981
and references therein). It breaks up into three distinct groups of
features.
knots
and blue stellar objects emanates from the centre of the galaxy more or
less along the direction of the jet. This chain starts at about 2' from the
nucleus and extends out to 28' (see the review by
Danziger 1981
and references therein). It breaks up into three distinct groups of
features.
The socalled inner jet structures of this chain
are found between 2' and 6'
(Dufour & van den
Bergh 1978);
the features closest to the nucleus are aligned with but offset from the
radiojet,
just where this starts to develop in the plume of the northern inner lobe.
The outermost features of this group continue at the same position angle,
although the radio plume expands away to the north. In their Fig. 1,
Morganti et al. (1991)
provided high-quality images as well as a very useful
diagram of the relative positions of optical and radio structures.
The next group out (commonly called the inner filaments) occurs
between 8' and 10' from the nucleus at the same position angle as the jet
(PA = 55°), although the outermost may start "veering off
course" (see
Morganti et al. 1992).
They are easily visible on long-exposure images
of NGC 5128 (cf.
Figs. 6 and
7). These filaments are in the
northern middle
radio lobe, but have no known specific radio counterpart. This may reflect
the lack of high-resolution radio images of the middle lobe more than
anything else and provides another rationale for obtaining such. The
filaments have very high [OIII] / H![]() ratios of about 15 and are blueshifted by up to
400 km s-1 from the systemic velocity of the
galaxy
(Osmer 1978;
Morganti et al. 1991).
They consist of turbulent low-density gas and coincide with
the soft X-ray emission associated with the northern middle lobe
(Feigelson et al. 1981;
Graham & Price 1981;
Graham 1983).
ratios of about 15 and are blueshifted by up to
400 km s-1 from the systemic velocity of the
galaxy
(Osmer 1978;
Morganti et al. 1991).
They consist of turbulent low-density gas and coincide with
the soft X-ray emission associated with the northern middle lobe
(Feigelson et al. 1981;
Graham & Price 1981;
Graham 1983).
The outer filaments (at 17.5') are also in the middle radio lobe, again without obvious radio counterpart at least at the low resolutions presently available. Their position angle, PA = 43° is markedly different from that of the other filaments (Fig. 6). In addition to the brightest main filaments, there are weaker features to the north and west. Graham (1983) measured some rather high blueshifts up to 1000 km s-1, but Morganti et al. (1991) found blueshifts of only 70-215 km s-1 for the main filaments.
The origin and excitation of the filaments has been a matter of some debate.
Although some of the features have spectra similar to those of "normal"
HII regions, several (notably the inner filaments) have spectra suggesting
photo-ionization by a (nuclear) power-law spectrum or by shock excitation.
Metallicities appear to rule out a primordial origin of the gas. The
filaments may be formed by the expanding radio lobes compressing ambient
gas to temperatures of a few million K followed by rapid cooling on a
timescale of 10 million years
(Feigelson et al. 1981;
Gouveia dal Pino &
Opher 1989).
Alternatively, the jet may consist of material ejected from the nuclear
region
(Graham & Price 1981),
although it is questionable whether this would
survive long enough to have reached the presently observed distance to the
nucleus
(Graham 1983).
In a rather extensive study of the filaments,
Morganti et al. (1991,
1992)
concluded that they are predominantly photoionized by the
radiation from the nucleus itself, extinguished in our line of sight but
travelling unimpededly along the jet. They proposed that a BL Lac nucleus
lies at the core of Centaurus A. This conclusion was tentatively supported
by Schiminovich et
al. (1994)
who found that the apparently counterclockwise
rotating HI clouds near these filaments have velocities very similar to
those found optically. However,
Viegas & Prieto
(1992)
argued that additional
heating mechanisms are required, and suggested the presence of shocks. They
also concluded that a mixture of optically thin and optically thick gas is
necessary for photoionization to be a viable explanation. In contrast,
Sutherland et al. (1993)
proposed that instead of photo-excitation, the
mechanical flux of a mildly supersonic low-density jet interacting with
dense ambient clouds is sufficient to energize shock waves with velocities
![]() 200-450
km s-1. Their model reproduces several observed
features of the filaments, and removes the need for a narrow ionizing
beam as proposed by
Morganti et al. (1991,
1992).
As the latter model predicts
strong UV line fluxes from the filaments, whereas the former does not,
such an observational test would be interesting.
200-450
km s-1. Their model reproduces several observed
features of the filaments, and removes the need for a narrow ionizing
beam as proposed by
Morganti et al. (1991,
1992).
As the latter model predicts
strong UV line fluxes from the filaments, whereas the former does not,
such an observational test would be interesting.
Finally, we note that the inner filaments are at the same position angle as the inner jets, the more distant outer filaments are at the same position angle as the bright NL-2 component (Clarke et al. 1992; see Fig. 5) in the plume, and the even more distant faint galaxy extensions in Fig. 8 line up with the NL-4 component in the plume (see Fig. 5). Whether this is accidental, or provides clues to their origin is unclear.
3 Spectral index ![]() is defined by S
is defined by S![]()
![]()
![]() Back.
Back.