


A recurring issue arises from the discussions in the earlier sections. Whilst observers are, with some restrictions, able to measure distant galaxy properties such as rest-frame colors, luminosities and star formation rates, these may be poor indications of the underlying stellar and total masses predicted most straightforwardly by contemporary models of structure formation. Either we put our faith in the forward modelling of the readily-available observables (i.e. we invest a lot of effort in understanding the complexities of feedback, Figure 7), or we consider how to measure galactic masses.
Ideally we seek methods for determining the total mass (baryonic plus the dark matter halo) but this seems out of reach for the moment except for local systems with tracers of the larger halo in which galaxies are thought to reside. Useful tracers here include the dynamical properties of attendant dwarf galaxies ([Zaritsky et al 1998]) and globular clusters ([Huchra et al 1998]). A promising route in the future might be galaxy-galaxy gravitational lensing ([Blandford & Narayan 1992]). Here a foreground population is restricted in its selection, perhaps according to morphology or redshift, and the statistical image distortions in a background population analysed. Early results were based on HST data, for cluster spheroidals ([Natarajan et al 1999]) and various field populations ([Griffiths et al 1996]), however with extensive panoramic data from the Sloan Digital Sky Survey, convincing signals can be seen with ground-based photometry ([Fischer et al 2000]). Again, photometric redshifts will be helpful in refining the sample selection and in determining the precise redshift distribution essential for accurate measures on an absolute scale.
Unfortunately, promising though the technique appears, the
restrictions of galaxy-galaxy lensing are numerous. It only gives
mass estimates for statistical samples: the signal is too weak to
be detected in individual cases, unless a strong lensing feature is seen
([Hogg et al 1996]).
Moreover, the redshift range and physical
scale on which the mass is determined is defined entirely by
geometrical factors and, ultimately, one may never be able to
apply the method to galaxies beyond z
 1.
1.
Extensive dynamical data is becoming available for restricted classes of high redshift galaxy, via linewidth measures ([Koo et al 1995]), resolved rotation curves ([Vogt et al 1997]) for sources with detectable [O II] 3727 Å emission, and via internal stellar velocity dispersions for absorption line galaxies such as spheroidals. Under certain assumptions, these give mass estimates and have enabled the construction of the fundamental plane for distant spheroidals ([Treu et al 2000]) and the Tully-Fisher relation for high redshift disk galaxies ([Vogt et al 1997]). The greatest progress in the former has been in constructing the fundamental plane in rich clusters ([van Dokkum et al 1998]) where slow evolution in the inferred mass/light ratio for cluster ellipticals is consistent with a high redshift of formation (see Section 5). For the emission line studies it is not straightforward to convert data obtained over a limited spatial extent into reliable masses even for regular well-ordered systems. For compact and irregular sources, the required emission lines may come from unrepresentative components yielding poor mass estimates ([Lehnert & Heckman 1996]).
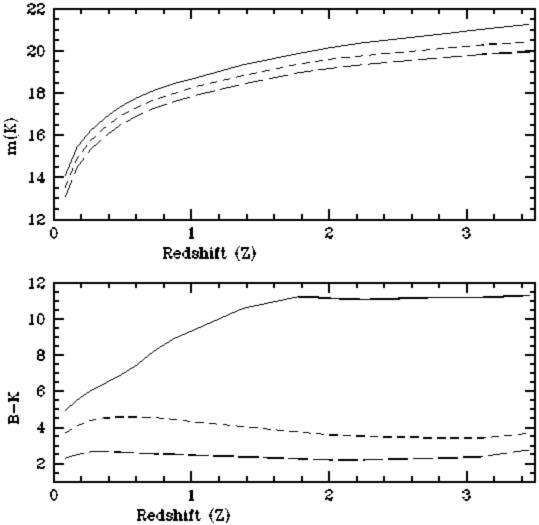
The prospects improve significantly if we drop the requirement to measure the total mass and are willing to consider only the stellar mass. In this case, the near-infrared luminosity is of particular importance. Broadhurst et al (1992) and Kauffmann & Charlot (1998) have demonstrated that the K (2 µm) luminosity is a good measure of its underlying stellar mass regardless of how that mass assembled itself (Figure 13). This remarkable fact arises because K-band light in all stellar populations (whether induced in bursts or continuous periods of activity) arises from long-lived giants whose collective output mirrors the amount of past activity, smoothing over its production timetable.
|
Figure 13. The K-band luminosity is a good
measure of the underlying stellar mass irrespective the past star
formation history
(Kauffmann &
Charlot 1998).
The curves show the
observed K magnitude as a function of the redshift at which such
an object is selected for a system containing 1011
M |
A deep K-band redshift survey thus probes the very existence of
massive systems at early times. A slightly incomplete survey to
K = 20
([Cowie et al 1996])
and a complete photometric survey to
K = 21
([Fontana et al
1999])
indicates an apparently shortfall of
luminous K objects beyond z
1-1.5 c.f. pure luminosity
evolution models. Unfortunately, small sample sizes,
field-to-field clustering, spectroscopic incompleteness and
untested photometric redshift techniques beyond z
1 each
weaken this potentially important conclusion. An important goal in
the immediate future must be to reconcile these claims with the
apparently abundant (and hence conflicting) population of
optical-infrared red objects to K
19-20
([Daddi et al 2000,
McCarthy et al
2000]).
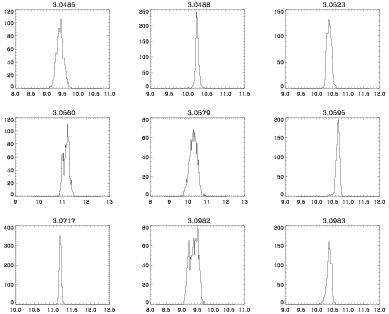
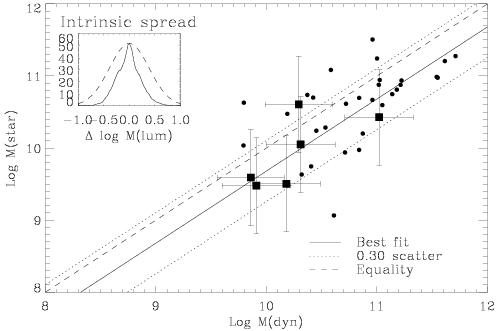
The precision of the technique introduced by Kauffmann & Charlot (1998) can be improved if the optical-infrared color is available as an extra parameter ([Ellis et al 2000]). In this way a first-order correction can be made for the past star formation history and hence the effect of the spread in the lower panel of Figure 13 can be used to improve the mass estimate. Importantly, such a technique for determine accurate stellar masses can then be applied to all galaxies, regular or peculiar, irrespective of their dynamical state and over a range in redshift (providing the data is sufficiently precise). The technique can be considered as a modification of that frequently utilised in estimating photometric redshifts. The observed optical-infrared SED for an object of known redshift is used to optimally fit the stellar mass rather than the redshift in the framework of an evolutionary synthesis code. Stellar masses can be derived to within a random uncertainty of 30-50% by this technique although at present there is no reliable way to verify the results except by comparison with independent dynamical measures (Figure 14).
|
|
Figure 14. The infrared method for
determining the stellar mass of a distant galaxy
(Ellis et
al. 2000).
The technique fits the observed SED for a galaxy of known redshift in the
context of evolutionary synthesis models where the stellar mass is
the fitted variable. (Top) Likelihood functions for the derived
logarithmic stellar mass for sample galaxies in the CFHT/LDSS
redshift survey (Brinchmann, Ph.D. thesis 1998); a typical
uncertainty of 30-50% is secured at I
|
 produced according to a variety of star formation histories. Even
across extreme cases (single burst at z =
produced according to a variety of star formation histories. Even
across extreme cases (single burst at z =
 , solid line, to a
constant star formation rate to the epoch of observation,
short-dash), the K-band output remains the same to within a
factor of
, solid line, to a
constant star formation rate to the epoch of observation,
short-dash), the K-band output remains the same to within a
factor of