


3.4. The location of high redshift galaxies with modest star formation rates
The most important feature of the HDF was the dedication of a significant fraction of the Discretionary Time to deep UV and blue exposures useful for locating the high redshift galaxies. Using photometry to constrain the redshift distribution from the effect of the Lyman limit was first attempted by Guhathakurta et al. (1990). They showed that the bulk of the R < 25 sources most probably had redshifts z < 3. Steidel & Hamilton (1992), Steidel et al. (1996a) later demonstrated prior to the HDF via their own imaging and Keck spectroscopy in QSO fields with Lyman limit absorption line systems. The broader significance of this work was amplified and extended to lower redshift using the shorter wavelengths available with the HDF. Although Giavalisco et al. (1996) had the first HST images of the z > 2.8 galaxies, the quality of the HDF images selected to be beyond z = 2.3 by a similar technique was considerably superior (Ellis 1996, Fig. 3).
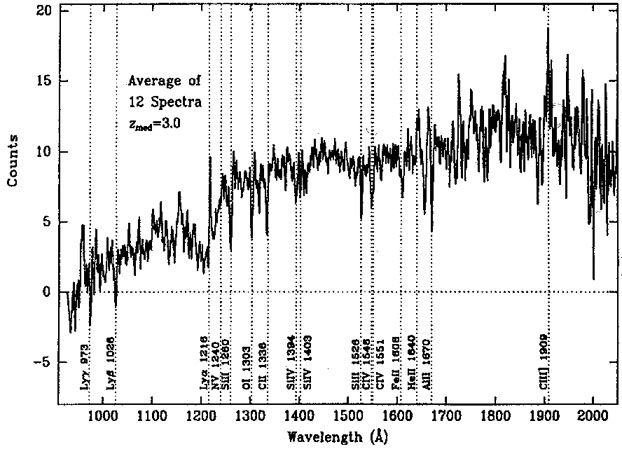
An interesting feature of this remarkable population is its relatively low abundance (compared to the huge number of foreground systems) and the modest inferred star formation rate derived from the ultraviolet continuum flux. Other speakers will elaborate on progress in this area and no doubt the precise star formation rates and the possibilities of misinterpretation will be raised. Enough spectra have now been taken (Fig. 4) for us to realize they are mostly metal poor precursors but of what kind of galaxy and with what mass is not yet clear. The crucial point for now is that via these and other observations, the volume density and spectral characteristics of star-forming galaxies at z > 2.3 have become available and confirmed what was suspected from the counts, sizes and morphologies: we are probably looking at the first era of star formation in some category of galaxy. Most of the activity which produced the regular Hubble sequence occurred at lower redshift.
|
Figure 4. Mean spectrum of the U dropouts in the HDF and flanking fields from the analysis of Lowenthal et al. (1997). |