


3.5. Constraints on the redshift distribution of the faintest systems
The multicolour HDF data has led to a resurrection of interest in estimating redshifts from colours. The technique goes back to Baum (1962), Koo (1985) and Loh & Spillar (1986). It is interesting to note that the method of photometric redshifts was heavily criticized by some at that time even though, in the case of Loh & Spillar, more than 4 filters were employed. (2) However, I think some people missed the point. In my opinion, the motivation is not to predict a precise redshift as a substitute for a spectrum, but rather to use the method to secure an overall statistical distribution N(z). Unfortunately the predominantly blue SEDs make this difficult to achieve using optical data at 1 < z < 2 because of the paucity of spectral discontinuities. Comparisons amongst the various HDF photometric redshift catalogues (Ellis 1997) shows no convincing evidence that the redshift resolution with 4 optical filters is any better beyond z ~ 1 than that associated with the Lyman limit moving through the filters. Of course, that is already important information! Moreover, the addition of near-infrared data should improve the situation considerably (Lanzetta, this volume). The first results from Connolly et al. (1997) are particularly interesting and suggest a mean redshift to J = 23.5 that is surprisingly low, in rough agreement with that inferred to R = 25.5 from the lensing inversion technique of Ebbels et al. (1997) when applied through rich well-constrained clusters such as Abell 2218 (Kneib et al. 1996) (Fig. 5).
|
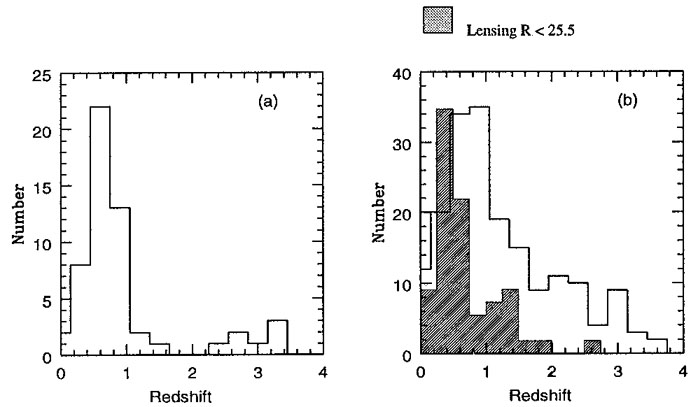
Figure 5. Redshift distributions of very faint galaxies: (a) using Keck spectroscopy in the HDF but to no formal magnitude limit, (b) photometric redshifts to J = 23.5 utilizing HDF 4-colour photometry and ground-based JHK photometry from the analysis of Connolly et al. (1997). The shaded distribution is that inferred to R = 25.5 from gravitational lensing viewed through the well-constrained cluster Abell 2218 (Ebbels et al. 1997). Regardless of the technique, a surprisingly large fraction of the population beyond the break point in the counts (Fig. 1) has z < 1. |
2 I remember at a conference in Erice
there were separate dining arrangements for those who
believed in photometric redshifts!
Back.