


2.2. Heavy-Element Abundance Ratios in Spiral Disks
Ratios of heavy elements, i.e., N/O and C/O, are expected to reveal in particular the characteristics of the IMF, stellar yields, and the history of star formation. Here we consider five ratios which are accessible through nebular studies: N/O, C/O, Ne/O, S/O, and Ar/O. Note that because planetary nebulae are self-contaminating with nitrogen and (sometimes) carbon, they do not make good probes of the interstellar levels for these elements, although in the cases of O, Ne, S, and Ar they seem to work satisfactorily in that capacity.
We consider the nitrogen abundance studies for the Milky Way disk indicated in Table 1 along with H II region studies by Kobulnicky & Skillman (1996), van Zee et al. (1998), Thurston, Edmunds, & Henry (1996), and Izotov & Thuan (1999) for external spirals. Figure 6 shows log(N/O) versus 12 + log(O/H) for both the Milky Way and extragalactic objects. Symbols are explained in the caption.
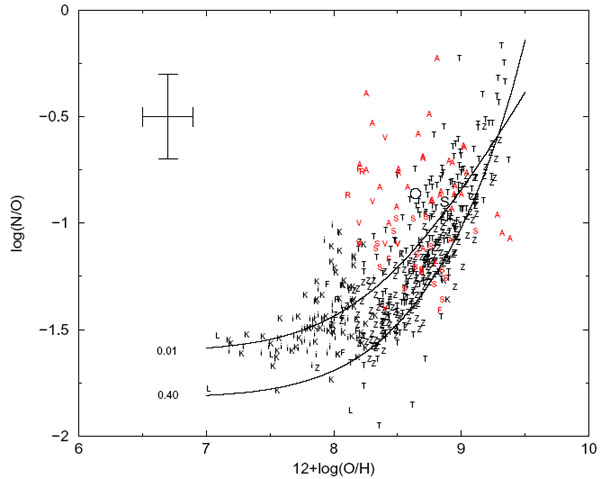 |
Figure 6. log(N/O) vs. 12 + log(O/H)
for H II regions in the Milky Way disk,
extragalactic spirals, and irregulars. Data for the Milky Way are from
Afflerbach et al. (1997; "A"),
Fich & Silkey (1991; "F"),
Shaver et al. (1983; "S"),
Rudolph et al. (1997; "R"),
and Vílchez & Esteban (1996;
"V"). Extragalactic data are from Izotov
& Thuan (1999; "i"),
Kobulnicky & Skillman (1996; "K"),
Thurston et al. (1996; "T"),
and van Zee et al. (1998; "Z").
The circle indicates the position of the Orion Nebula
(Esteban et al. 1998),
the large "S" shows the position of the Sun
(Grevesse et al. 1996),
and the "L" symbols at extremely low oxygen show upper limits for three
high-redshift damped
Ly |
The most striking feature in Figure 6 is the
apparent threshold running from the lower left to upper right beginning
around 12 + log(O/H) = 8.25 and breached by only a few objects. Behind
this line the frequency of objects drops off toward lower values of 12 +
log(O/H) and higher values of log(N/O). A second feature is the behavior
of N/O at values of 12 + log(O/H) < 8, where N/O appears constant, a
trend which seems to be reinforced by the upper limits provided by the
damped
Ly objects of
Lu et al. (1996; "L")
at very low metallicity. This bimodal behavior of N/O was pointed out by
Kobulnicky & Skillman (1996).
Although detailed theoretical interpretations are beyond our scope, we
summarize below the basic ideas of nitrogen production and attempt to
tie them to Figure 6. Readers interested in
additional detail are urged to refer to
Vila-Costas & Edmunds (1993).
objects of
Lu et al. (1996; "L")
at very low metallicity. This bimodal behavior of N/O was pointed out by
Kobulnicky & Skillman (1996).
Although detailed theoretical interpretations are beyond our scope, we
summarize below the basic ideas of nitrogen production and attempt to
tie them to Figure 6. Readers interested in
additional detail are urged to refer to
Vila-Costas & Edmunds (1993).
Nitrogen is mainly produced in the six steps of the CN branch of the CNO
bi-cycle within H burning stellar zones, where 12C serves as
the reaction catalyst (see a textbook such as
Clayton 1983 or
Cowley 1995
for nucleosynthesis review). Three reactions occur to transform
12C to 14N: 12C(p,
 )
13N(
)
13N( +
+ )
13C(p,
)
14N, while the next step, 14N(p,
)
O15, depletes nitrogen and has a relatively low cross
section. The final two reactions in the cycle transform 15O
to 12C. Since the fourth reaction runs much slower than the
others, the cycle achieves equilibrium only when 14N
accumulates to high levels, and so one effect of the CN cycle is to
convert 12C to 14N. The real issue in nitrogen
evolution is to discover the source of the carbon which catalyzes the
process.
)
13C(p,
)
14N, while the next step, 14N(p,
)
O15, depletes nitrogen and has a relatively low cross
section. The final two reactions in the cycle transform 15O
to 12C. Since the fourth reaction runs much slower than the
others, the cycle achieves equilibrium only when 14N
accumulates to high levels, and so one effect of the CN cycle is to
convert 12C to 14N. The real issue in nitrogen
evolution is to discover the source of the carbon which catalyzes the
process.
Since stars produce their own carbon during He burning, nitrogen originating from it is termed primary nitrogen. Any nitrogen produced during supernova explosive nucleosynthesis is also termed primary since it is created for the first time during the explosion. On the other hand, stars beyond the first generation in a galactic system already contain some carbon inherited from the interstellar medium out of which they formed. Nitrogen produced from this carbon is termed secondary nitrogen.
As a system begins to mature chemically from a state of low metallicity, nitrogen must come from carbon produced by the star itself, since at this point no significant level of carbon exists in the ISM which can be incorporated into new stars and enter into the CN cycle. So, nitrogen production is primary and its evolution proceeds at a rate set only by star formation coupled with the primary production rate of nitrogen. Since the production of elements such as oxygen is being influenced by similar factors, the N/O ratio should remain constant as their abundances rise together.
But as metallicity rises and stars form out of progressively more metal-rich environments, the amount of carbon present in the star at birth which can ultimately enter the CN cycle becomes comparable to the amount produced internally through He burning, and thus nitrogen production becomes secondary and coupled to the metallicity of the star. At this point, N/O versus O/H assumes a positive slope, since the relation between N and O is now quadratic (Vila-Costas & Edmunds 1993).
Based upon the data and models presented in Figure 6 and allowing for the scatter, a reasonable explanation for the observed trend for N/O is that the flatter behavior seen at 12 + log(O/H) < 8.0 corresponds to the dominance of primary nitrogen production, while the steeper slope in N/O at higher metallicities is linked to metallicity-sensitive secondary nitrogen production. We concur with Shields, Skillman, & Kennicutt (1991), who found that the point at which secondary nitrogen production becomes important is located at roughly 12 + log(O/H) = 8.3 or 0.6 dex below solar.
A comparison of nitrogen yields from intermediate mass stars (1-8
M ) by
van den Hoek & Groenewegen (1997)
with those from massive stars by
Nomoto et al. (1997a)
suggests that intermediate mass stars are ultimately the main
contributors to nitrogen production, although early-on massive stars may
play a role, due to the longer evolutionary timescales for less massive
stars, and thus their delay in depositing nitrogen into the interstellar
medium.
Vila-Costas & Edmunds (1993)
calculated analytical models for the evolution of N/O assuming a simple,
closed-box regime but accounting separately for primary and secondary
nitrogen yields along with time delays in intermediate-mass-star
nucleosynthesis. The two curves in Figure 6
represent their results using their equation (A5) along with two
different values for the ratio of time delay to the system age. We have
adopted values for constants a and b in their formula of
0.025 and 120, respectively, to force a better fit to the data presented
here. The curve representing the small delay clearly matches the
low-metallicity data better, while the curve for greater delay seems to
rise faster at high metallicity and thus fit the data there better.
) by
van den Hoek & Groenewegen (1997)
with those from massive stars by
Nomoto et al. (1997a)
suggests that intermediate mass stars are ultimately the main
contributors to nitrogen production, although early-on massive stars may
play a role, due to the longer evolutionary timescales for less massive
stars, and thus their delay in depositing nitrogen into the interstellar
medium.
Vila-Costas & Edmunds (1993)
calculated analytical models for the evolution of N/O assuming a simple,
closed-box regime but accounting separately for primary and secondary
nitrogen yields along with time delays in intermediate-mass-star
nucleosynthesis. The two curves in Figure 6
represent their results using their equation (A5) along with two
different values for the ratio of time delay to the system age. We have
adopted values for constants a and b in their formula of
0.025 and 120, respectively, to force a better fit to the data presented
here. The curve representing the small delay clearly matches the
low-metallicity data better, while the curve for greater delay seems to
rise faster at high metallicity and thus fit the data there better.
Further study of the origin of nitrogen will require especially more
abundances for systems of low metallicity where 12 + log(O/H) <
7. Studies of damped Ly
systems currently offer great promise in this regard.
Carbon is produced during core and shell helium burning in the triple
alpha process, 34He
 12C. It is
an element whose abundance has lately become more measurable in
extragalactic H II regions, thanks to the
Hubble Space Telescope (HST) and its UV capabilities,
since the strong carbon lines of C III] and C
IV appear in that spectral region. Recent studies
of extragalactic H II regions have been carried
out by Garnett et al.
(1995,
1997,
1999) and
Kobulnicky & Skillman (1998),
while carbon abundances for M8 and the Orion Nebula, both within the
MWG, have been measured by
Peimbert, Torres-Peimbert, & Dufour
(1993) and
Esteban et al. (1998), respectively.
12C. It is
an element whose abundance has lately become more measurable in
extragalactic H II regions, thanks to the
Hubble Space Telescope (HST) and its UV capabilities,
since the strong carbon lines of C III] and C
IV appear in that spectral region. Recent studies
of extragalactic H II regions have been carried
out by Garnett et al.
(1995,
1997,
1999) and
Kobulnicky & Skillman (1998),
while carbon abundances for M8 and the Orion Nebula, both within the
MWG, have been measured by
Peimbert, Torres-Peimbert, & Dufour
(1993) and
Esteban et al. (1998), respectively.
Results of these measurements are collected together in Figure 7, where log(C/O) is plotted against 12 + log(O/H). The point for Orion is indicated with an "O," M8 with "M," and the Sun with an "S" (Grevesse, Noels, & Sauval 1996). The vertical lines connect points corresponding to carbon abundances determined with two different reddening laws by Garnett et al. (1998). The filled circles correspond to stellar data from Gustafsson et al. (1999) for a sample of F and G stars.
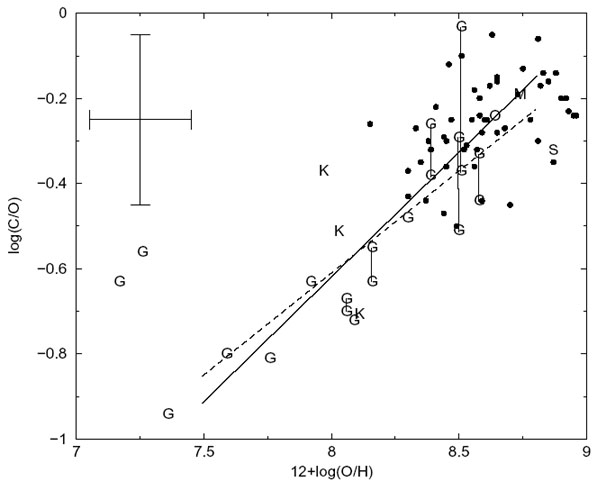 |
Figure 7. log(C/O) vs. 12 + log(O/H) for extragalactic H II regions. Data are from Garnett et al. (1995, 1997, 1999; "G") and Kobulnicky & Skillman (1998; "K"), while "M" and "S" show the positions of the Galactic H II region M8 and the Sun, respectively. The filled circles show F and G stellar data from Gustafsson et al. (1999). Garnett et al. employed two different reddening laws (see text), and hence these points are joined by vertical lines. Typical uncertainties are shown in the upper left. Regression lines are explained in the text. |
A direct correlation between C/O and O/H is strongly suggested and has
been noted before (cf.
Garnett et al. 1999),
although the result is weakened somewhat by the two points for I Zw 18
around 12 + log(O/H) = 7.25. Ignoring these two points as well as the
ones for the Sun and stellar data, and performing a regression analysis,
we find that log(C/O) = -5.34(± 0.68) + 0.59(± 0.08)[log(O/H)
+ 12]
(Fig. 7, solid line) with a correlation
coefficient of 0.88 when we exclude
Garnett et al.'s (1999)
data points corresponding to Rv = 5 (the
connected points with lower C/O), log(C/O) = -4.45(± 0.60) +
0.48(± 0.07)[log(O/H) + 12] (Fig. 7,
dashed line) with a correlation coefficient of 0.86 when points
for Rv = 3.1 (the connected points with higher
C/O) are excluded. Assuming that with additional data the trend becomes
more robust, it clearly implies that carbon production is favored by
higher metallicities. One promising explanation
(Prantzos, Vangioni-Flam, & Chauveau
1994;
Gustafsson et al. 1999)
is that mass loss in massive stars is enhanced by the presence of metals
in their atmospheres which increase the UV cross section to stellar
radiation. Stellar yield calculations by
Maeder (1992)
appear to support this claim. The contributions to carbon by different
stellar mass ranges is discussed by both Prantzos et al. and Gustafsson
et al., who conclude that the massive stars are primarily responsible
for carbon production. It is also clear, however, that stars of mass
less than about
5 M
produce and expel carbon as well
(van den Hoek & Groenewegen 1997),
and thus the relative significance of massive and intermediate-mass
stars is still not understood completely.
Neon is produced through carbon burning (12C + 12C
20Ne +
4He), while both sulfur and argon originate from explosive
oxygen burning in Type II supernova events (16O +
16O
28Si +
4He, then 28Si + 4He
32S;
32S + 4He
36Ar). In
addition, substantial amounts of S and Ar may be manufactured in Type Ia
supernova events (Nomoto et
al. 1997b). Note that here we refer only to the dominant isotopes of
the respective elements.
Abundance ratios of Ne/O, S/O, and Ar/O are plotted logarithmically
against 12 + log(O/H) in Figure 8. To the data
of Shaver et al. (1983) and
Maciel & Köppen (1994)
for the Milky Way we have added data for Ne/O, S/O, and Ar/O from
optical studies of extragalactic H II regions
from
van Zee et al. (1998) and
Izotov & Thuan (1999)
along with S/O results from
Garnett (1989)
for both the MWG and extragalactic H II
regions. Representative uncertainties are ± 0.20 dex in each of the
three ratios and ± 0.20 dex in 12 + log(O/H). The horizontal lines
in each panel represent the predictions from
Nomoto et al. (1997b;
dashed lines),
Woosley & Weaver (1995;
dot-dashed lines), and
Samland (1998;
solid lines) for massive star yields integrated over a Salpeter
IMF between 10 and 50
M and
corrected to give ratios by number.
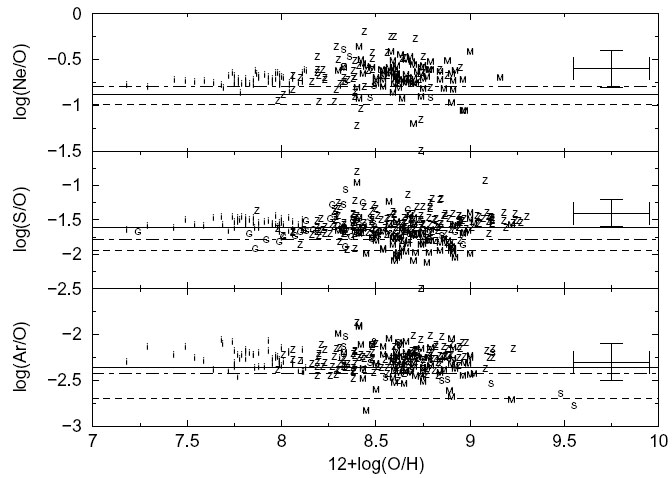 |
Figure 8. Logarithmic Ne/O, S/O, and Ar/O vs. 12 + log(O/H) taken from information in numerous Galactic and extragalactic studies of H II regions and planetary nebulae. Symbols are defined in the captions of Figs. 2, 6, and 7. The horizontal lines show stellar yield predictions from Nomoto et al. (1997b; dashed lines), Woosley & Weaver (1995; dot-dashed lines), and Samland (1998; solid lines) for massive star yields integrated over a Salpeter IMF and corrected to give ratios by number. Typical uncertainties are indicated with error bars. |
All three panels of Figure 8 show vertical
ranges which are consistent with uncertainties and thus imply in each
case a constant value for each ratio over the 1.5-2 decades of oxygen
abundance. Logarithmic values for unweighted arithmetic averages (log
average antilog) and standard deviations (not uncertainties) for Ne/O,
S/O, and Ar/O are presented in Table 3, where the
first column identifies the sample by the last name of the first author,
followed by three columns indicating the sample sizes for Ne/O, S/O, and
Ar/O, respectively. Also included are averages for the total of all
samples, solar values
(Grevesse et al. 1996),
and ratios found in the Orion Nebula
(Esteban et al. 1998)
and the Helix Nebula
(Henry, Kwitter, & Dufour 1999),
a nearby planetary nebula. Generally, for each abundance ratio there is
very good agreement among the five samples, considering observational
uncertainties. Notice the smaller dispersion associated with the Izotov
& Thuan data. This may be explained by their focus on metal-poor H
II regions possessing very bright emission lines
with a resulting signal-to-noise ratio of 20-40 in the continuum and
abundances frequently having uncertainties of less than ± 0.10 dex
compared with the typical ± 0.20 dex uncertainties in other samples
(Y. I. Izotov 1999, private communication). In addition, we note the
significant disparity between Ar/O for Orion and the other samples along
with the Sun and the Helix Nebula. Due to the limited spectroscopic
range, the argon abundance in Orion was determined using the weak 5192
Å auroral line of Ar+2, where its strength was observed
to be on the order of 10-3 times
H. Use of
stronger near IR lines may bring the argon abundance in Orion into
agreement with other objects (C. Esteban 1999, private
communication). In addition, the S/O ratio found in the Helix Nebula is
an order of magnitude below the average value. This is currently
difficult to interpret, although a few planetary nebulae do show sulfur
abundances which are this low (see
Henry et al. 1999).
| SAMPLE b | Sample Sizes
|
Averages and Standard
Deviations |
||||
| Ne/O | S/O | Ar/O | log (Ne/O) | log (S/O) | log (Ar/O) | |
| Shaver... | 9 | 7 | 16 | -0.69 ± 0.16 | -1.40 ± 0.19 | -2.29 ± 0.16 |
| Maciel... | 76 | 77 | 73 | -0.66 ± 0.12 | -1.70 ± 0.22 | -2.27 ± 0.14 |
| Garnett... | 0 | 36 | 0 | ... | -1.62 ± 0.14 | ... |
| van Zee... | 56 | 173 | 129 | -0.62 ± 0.18 | -1.48 ± 0.26 | -2.24 ± 0.17 |
| Izotov... | 54 | 49 | 53 | -0.72 ± 0.05 | -1.55 ± 0.06 | -2.25 ± 0.09 |
| Total... | 195 | 342 | 271 | -0.67 ± 0.14 | -1.55 ± 0.24 | -2.25 ± 0.15 |
| Solar c... | ... | ... | ... | -0.79 | -1.54 | -2.35 |
| Orion d... | ... | ... | ... | -0.75 | -1.46 | -1.84 |
| Helix e... | ... | ... | ... | -0.48 | -2.49 | -2.17 |
a Arithmetic averages,
i.e., log mean antilog.
| ||||||
The evidence provided by Table 3 and Figure 8 supports the contention that abundances of Ne, S, Ar, and O evolve in lockstep, a point made by Henry (1989) in his earlier study of Ne and O in planetary nebulae. This would be expected if these elements are all produced by either massive stars within a narrow mass range or stars of different masses but with an invariant IMF. Under these conditions their buildup is expected to proceed in lockstep, and the ratios of Ne/O, S/O, and Ar/O should have constant values over a range of O/H.
Interesting departures from the universality of the ratios displayed in Figure 8 appear in halo planetary nebula studies. The detailed one by Howard et al. (1997), for example, confirms earlier indications that the object BB-1 has log(Ne/O) of -0.11, while log(Ne/O) for H4-1 has a value of -1.82. These deviants might be explained by local abundance fluctuations caused by recent supernova events whose ejecta, differing in composition because of mass cut differences in the explosive event, had not yet mixed in with the surrounding ISM before the PN progenitor formed out of it.
Finally, notice that predicted ratios from the yields for stars in the
10-50 M
mass range, represented by the horizontal lines, generally fall below
the observed average, with the offset for Nomoto et al. consistently
being the largest. This suggests that the theoretical calculations
overproduce oxygen and further implies that the adopted rate of the
12C(,
)
16O reaction in the models is too high, resulting in a higher
conversion rate of 12C to 16O with a boost in the
oxygen production relative to elements such as Ne, S, and Ar. This
conclusion agrees at least qualitatively with comparisons by
Nomoto et al. (1997a)
of yields from two 25
M
stellar models using significantly different values of the
12C(,
)
16O rate. Another explanation in the case of S/O and Ar/O may
be that the predicted yields do not include contributions from Type Ia
supernovae, which produce significant amounts of 32S and
36Ar, according to
Nomoto et al.'s (1997b)
W7 model. Adding this source to yields of massive stars would raise the
theoretical line. This subject should be explored in more detail,
particularly since the Ne/O ratio ought to provide a good constraint on
the value of the
12C(,
)
16O rate.