


2.10. Determining redshifts of submm galaxies
By virtue of their uniform selection function with redshift, it is impossible to even indicate the redshift of submm galaxies from single-wavelength submm flux densities alone. The relatively poor positional accuracy of submm images also makes it very difficult to identify an unambiguous optical counterpart for spectroscopic follow-up. This will be discussed in more detail when the properties of individual galaxies are described in Section 3. Here we discuss some general features of the prospects for determining their redshifts from submm, far-IR and radio observations.
2.10.1. Photometric redshifts from far-IR SEDs
The submm-far-IR SED of dusty galaxies is thermal, and so redshifting a fixed template SED affects the observed colors in exactly the same way as changing the dust temperature. This means that even when multi-frequency far-IR data is available, the redshift will be uncertain, unless there is information about the intrinsic dust temperature of the source. This effect is related to the selection effect in favor of cold galaxies illustrated in Fig. 5. The expected colors of dusty galaxies, as a function of (1 + z) / Td, the parameter that can be constrained in light of this degeneracy, is shown in Fig. 6. Colors in a variety of observing bands in both submm atmospheric windows and for the observing bands of the MIPS instrument on the Space InfraRed Telescope Facility (SIRTF) 12 satellite are included. It is vital to stress that without knowledge of the dust temperature, it is impossible to determine a redshift from any combination of multicolor broadband far-IR/submm data. The degeneracy between Td and z is lifted partially by combining information derived from radio observations, if Td > 60 K. It may also become clear that there is a Universal temperature-luminosity relation that extends to high redshifts, and can be exploited to determine redshift information using a far-IR-submm color-magnitude relation. In the absence of such a Universal relation, far-IR and submm colors can only be used to fix the parameter (1 + z) / Td reliably.
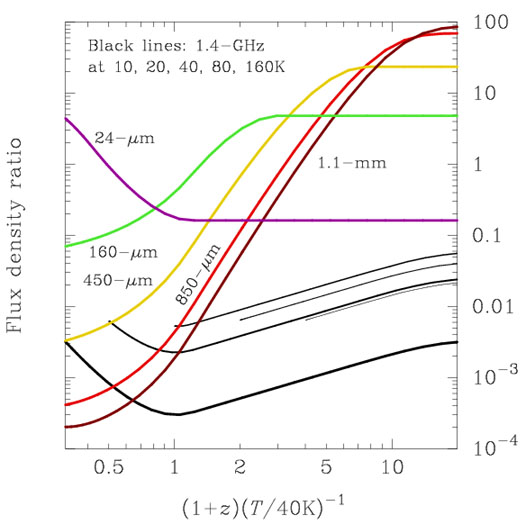 |
Figure 6. The ratio of flux densities expected in different observing bands as a function of the degenerate redshift/dust temperature parameter, compared with the flux density expected in the 70-µm band at which the SIRTF satellite will be very sensitive. Where the lines have steep gradients, measured colors from multi-band data locate the peak of the dust SED accurately in the observer's frame, providing a measurement of temperature-redshift. The degeneracy between Td and z can be lifted slightly by including radio data (Blain, 1999a; Yun and Carilli, 2002), if the dust temperature is greater than about 60 K (see also Fig. 7). If deep near-IR and optical images can be included, and the optical counterpart to the galaxy can be readily identified, then conventional photometric redshifts can be determined from stellar synthesis models. However, care must be taken as it is unclear whether the SEDs of very dusty galaxies have familiar restframe-optical spectral breaks. |
2.10.2. Radio-submm photometric redshifts
In Fig. 4, an estimate of the flux
density of radio emission of a template
dusty galaxy was shown as a function of redshift.
We now investigate the radio properties of
submm galaxies, which provide useful information about their SED and
redshift. There is an excellent observed correlation between the radio
and far-IR (60- and 100-µm) flux densities of low-redshift
galaxies over 4 orders of magnitude in luminosity, reviewed by
Condon (1992)
and recently investigated out to
z  0.3 by
Yun et al. (2001).
If this correlation is assumed to hold to high redshifts, then
submm-selected galaxies should be
detectable in the deepest 10-µJy-RMS 1.4-GHz VLA radio
images out to redshifts of order 3.
Note that as a result of this correlation, optical spectroscopy of
faint non-AGN radio galaxies alone can be used to trace the evolution of
star-formation activity to redshifts
z 1.2, beyond
which spectroscopic redshifts are hard to determine
(Haarsma et al., 2000).
0.3 by
Yun et al. (2001).
If this correlation is assumed to hold to high redshifts, then
submm-selected galaxies should be
detectable in the deepest 10-µJy-RMS 1.4-GHz VLA radio
images out to redshifts of order 3.
Note that as a result of this correlation, optical spectroscopy of
faint non-AGN radio galaxies alone can be used to trace the evolution of
star-formation activity to redshifts
z 1.2, beyond
which spectroscopic redshifts are hard to determine
(Haarsma et al., 2000).
The far-IR-radio correlation is thought to be due to a match between the rate at which the optical/UV radiation from young stars is absorbed by dust on a local scale in star-forming regions of galaxies, and re-emitted as thermal far-IR radiation, and the radio luminosity from the same regions (Harwit and Pacini, 1975). The radio luminosity is due to both free-free emission in HII regions, and more importantly at frequencies less than about 10 GHz, to the synchrotron emission from relativistic electrons accelerated in supernova shocks. If an AGN is present, then it is likely that its accretion disk will provide an additional source of UV photons to heat dust, and both the disk and outflows will generate shocks to accelerate relativistic electrons. There is little reason to expect these effects to be proportional, unlike UV heating by massive stars and particle acceleration by supernova shocks in star-forming regions. Radio-quiet QSOs tend to lie on the radio-loud side of the far-IR-radio correlation, while radio-loud AGN can lie up to three orders of magnitude away.
Carilli and Yun (1999, 2000) demonstrated that the radio-submm color is a useful redshift indicator, assuming that dusty galaxies have simple synchrotron SEDs in the radio waveband and thermal dust spectra in the submm and far-IR wavebands. The radio-submm color was also considered in the interpretation of the redshifts of galaxies detected in the submm surveys by Hughes et al. (1998), Lilly et al. (1999) and Eales et al. (2000). The Carilli-Yun redshift indicator is subject to a degeneracy between dust temperature and redshift, at dust temperatures less than about 60 K: see Fig. 7 in which its form is shown for a variety of SEDs. Hot, distant galaxies are difficult to distinguish from cool, low-redshift ones (Blain, 1999a, b). Despite this degeneracy, the Carilli-Yun redshift indicator is very useful, especially for investigating optically faint submm galaxies for which almost no other information is available (Smail et al., 2000). AGN, which are expected to be radio-loud as compared with the standard far-IR-radio correlation, lead to conservatively low Carilli-Yun estimated redshifts.
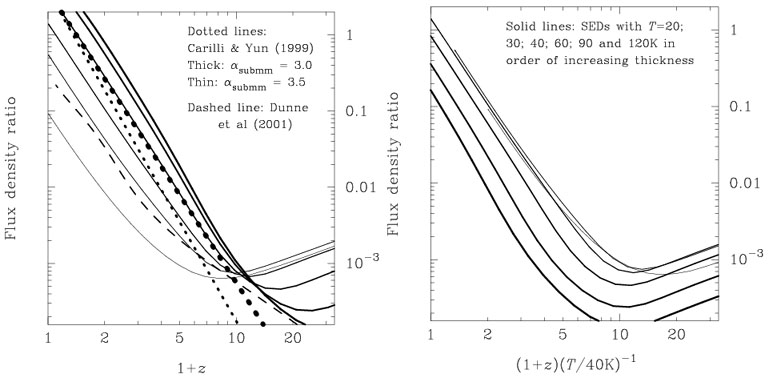 |
Figure 7. The behavior of the Carilli-Yun 1.4-GHz to 850-µm radio-submm redshift indicator. The left panel shows the ratios of 1.4-GHz:850-µm flux density predicted from empirical SEDs by Carilli and Yun (1999; dotted lines) and Dunne et al. (2000; dashed line; see also Carilli and Yun, 2000). Predictions for the ratio based on the results of Blain (1999a) are also shown assuming radio-far-IR SEDs with various dust temperatures, but which all lie on the far-IR-radio correlation (Yun et al., 2001; solid lines). The flux ratio is a good indicator of redshift, clearly separating high- and low-redshift galaxies. Both synchrotron and free-free radio emission are included, and the dust temperature and radio properties evolve with redshift self-consistently, as modified by the CMB. In the right panel, the solid curves are replotted as a combined function of temperature and redshift, emphasizing that for Td < 60 K, the inferred temperature and redshift are degenerate, just as for a thermal spectrum (Fig. 6). For Td > 60 K the flux ratio becomes a non-degenerate redshift indicator. |
At the highest redshifts, two additional factors arise to modify the relation expected. First, synchrotron emission from relativistic electrons is likely to be suppressed. The intensity of synchrotron emission depends on only the energy density in the interstellar magnetic field, while the total cooling rate of the electrons depends on the sum of the energy densities in the interstellar magnetic field, for synchrotron losses, and in the ISRF, for inverse Compton scattering losses. The tight low-redshift far-IR-radio correlation implies that these energy densities are proportional over a very wide range of galaxy properties (Völk, 1988). However, above some critical redshift, the energy density in the CMB will always rise to dominate the ISRF, upsetting this balance. Inverse-Compton electron cooling will then dominate and the amount of synchrotron emission will decline. Note, however, that free-free emission does not suffer this suppression at high redshifts, and so should remain detectable out to any practical redshift. The almost flat SED of free-free emission ensures a more favorable K correction for high-redshift galaxies than expected for a pure synchrotron emission spectrum. The free-free emission spectrum cuts off only at photon energies greater than the thermal energy of emitting electrons in HII regions. In the absence of free-free optical depth effects, for 104-5 K this corresponds to optical frequencies (Yun and Carilli, 2002). In Fig. 8 we show the effects of CMB suppression of synchrotron emission, for a ratio of energy densities in the magnetic field and the ISRF of 0.33, which is reasonable for M82 and the Milky Way (Hummell, 1986). We assume a galaxy SED template that lies on the standard far-IR-radio correlation at z = 0 (Condon, 1992).
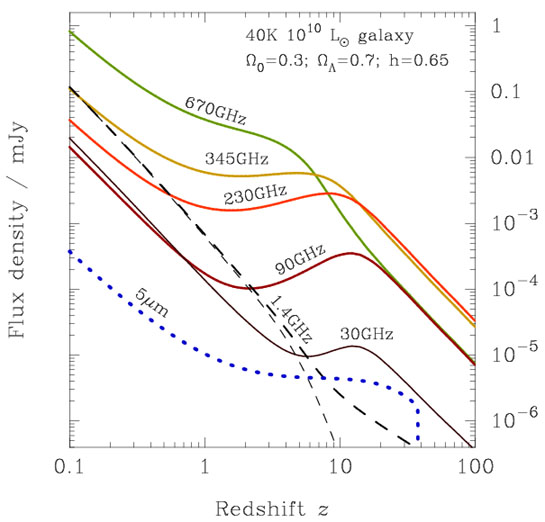 |
Figure 8. Some key features of flux
density-redshift relations
expected at a range of wavelengths, extending to very high redshifts.
CMB heating of dust at z > 10 prevents the mm-wave
K correction from assisting the detection of very high redshift galaxies:
the flux density-redshift relation has the same redshift dependence
beyond z |
Secondly, again most significant at high redshifts, a minimum dust
temperature is imposed by the rising CMB temperature: dust
must be hotter than the CMB. Given that observed dust temperatures in
ultraluminous galaxies seem to lie in the range 40-100 K, then this
may become an important factor at redshifts 10 < z < 30, if
an early generation of stars generates the heavy elements required to form
dust prior to these redshifts. For cooler Milky-Way-like SEDs, this
effect would be important at
z 5.
An increase in dust temperature due to CMB heating at
high redshifts shifts the peak of the dust SED to
higher frequencies, counteracting the beneficial K correction illustrated
in Fig. 4. As a result, there is
a firm upper limit to the redshift at which submm continuum
radiation can be exploited to image the most distant galaxies efficiently,
even if these galaxies do contain dust. This is illustrated by
the flux density-redshift relations at 230, 90 and 30 GHz shown in
Fig. 8: at redshifts greater than about 15 all
three curves have the same form.
Both of these factors were included in the derivation of the curves in Fig. 7, which should thus provide an accurate guide to the usefulness of the Carilli-Yun redshift indicator out to the highest redshifts. Note that the indicator becomes of little use for the most distant galaxies, for which an almost constant radio:submm flux ratio of about 10-3 is expected. In addition, the hottest dusty galaxies may be more likely to contain AGN, and thus to lie on the radio-loud side of the far-IR-radio correlation. This effect could make the interpretation of Fig. 7 for determining redshifts ambiguous, even if Td > 60 K. However, it should always guarantee a conservative estimate of the redshift for any observed galaxy.
Foreground absorption is not a problem for
very high-redshift sources of any radio, submm or far-IR radiation.
It is thus likely that the most sensitive future instruments at submm
and radio wavelengths, ALMA and the SKA will both be able to
detect `first light' galaxies. Note, however, that a mask of foreground
structure may be significant for radio observations
(Waxman and Loeb, 2000).
A practical
limit to the capability of determining the history of very early star
formation from an `SKA deep field' could also be set by the low,
cosmologically-dimmed
surface brightness of galaxies at the highest redshifts, and their
potentially overlapping emission regions. The importance of both of these
factors is expected to depend critically on the unknown physical sizes of
the first galaxies. ALMA will probably be limited to observe
galaxies out to a maximum redshift set by the requirement
that sufficient metals have been generated to form obscuring dust at that
early epoch. To compare what might be possible in the near-IR waveband,
the emission from a
3 × 10⁴-K blackbody stellar photosphere
at 5 µm is shown in Fig. 8,
cutoff at the redshift beyond which absorption by redshifted
Lyman- becomes important in the band. This indicates the potential for
probing the earliest galaxies using a near-IR camera on the
Next Generation Space Telescope (NGST).
Free-free emission and redshifted near-IR
stellar emission may thus be the best routes to the detection of
the first galaxies at redshifts greater than 10, if they exist.
becomes important in the band. This indicates the potential for
probing the earliest galaxies using a near-IR camera on the
Next Generation Space Telescope (NGST).
Free-free emission and redshifted near-IR
stellar emission may thus be the best routes to the detection of
the first galaxies at redshifts greater than 10, if they exist.