


Over the last 30 years observations, in particular rotation curves derived from HI data, have clearly established that the "visible" parts of a spiral galaxy, i.e. the stellar bulge and disk, and the HI gas layer, cannot account for the observed high rotation speeds in the outer parts of spirals, if the stellar mass-to-light ratio is constant with radius. This discrepancy is attributed to unseen matter, often taken to be a (spherical) dark halo. Several issues complicate this picture :
Assumptions going into the derivation of the rotation curve. A large fraction of galaxies have a warped HI layer in the outer parts, which is modelled with a "tilted ring" model in which the orientation of the rings is gradually changed to allow for the peculiarities of the velocity field. Non-axisymmetric disturbances, such as bars or oval distortions, or peculiar velocities due to spiral structure, are in first instance ignored, and an azimuthally averaged rotation curve derived. Asymmetries, if small enough, are likewise ignored. All these assumptions may introduce systematic errors in the derived rotation curves at the 5 - 15% level.
Values of the mass-to-light ratio are not well determined. This leads to a degeneracy in the mass models. At one extreme, the maximum disk approach tries to fit as much of the mass into the disk as possible, without overshooting the rotation curve. For optical curves, most galaxies can then be fitted without a dark halo, due to the limited extent of the curve. In Figure 1 I plot, for a sample of galaxies studied by Palunas & Williams (2000), the M/LI-ratio they determined from maximum disk fits against the extinction corrected (B-I) colour I collected from the LEDA database. For large galaxies a trend exists: on average redder disks have higher M/L ratios, as expected e.g. in models from Bell & De Jong (2001). Yet there is a fair amount of scatter in each class of galaxies selected according to their maximum rotation velocity Vmax, in particular for smaller (bluer) galaxies. The required M/L values are too high compared to those predicted by Bell & De Jong's "preferred" Initial Mass Function (IMF), the "scaled IMF" = 0.7 * Salpeter curve, based on maximum disk + halo fits for Ursa Major galaxies (Verheijen 1997). The extreme maximum disk models of the galaxies in the Palunas & Williams sample require a bottom heavier IMF.
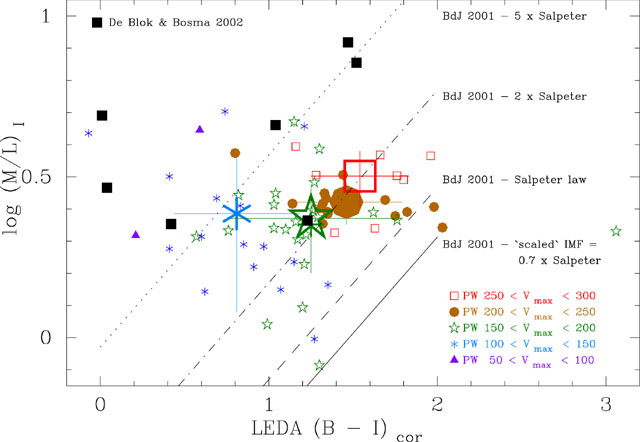 |
Figure 1. Relation between the mass-to-light ratio in the I-band and the global (B-I) colour corrected for galactic and internal extinction, from the LEDA database, for galaxies in the Palunas & Williams (2000) sample. Different symbols indicate differences in the maximum rotation velocity Vmax. Large symbols represent averages per class of Vmax. Various lines indicate models from Bell & De Jong (2001, table 1), different only in the scaling of the IMF. Black squares come from data of De Blok & Bosma (2002) for LSB galaxies, rescaled to the I-band. |
This problem is aggravated for low surface brightness (LSB) disk galaxies, as is shown by the few points taken from models of such galaxies by De Blok & Bosma (2002). This clearly illustrates that the dark matter problem in these galaxies is much worse, and has lead to the assumption that even a "minimum disk" (M/L = 0) is a reasonable approximation to the real mass distribution.
Scaling the HI can produce a good fit instead of a halo. Bosma (1978) noticed that the surface density ratio of HI gas mass to total mass becomes constant with radius in the outer parts. Reversely, one can thus scale the curve for the HI gas with a certain factor to fit the rotation curve, instead of with a halo. Hoekstra et al. (2001) did this for a number of spirals, and Swaters (1999) for a number of dwarf galaxies. The scaling factor is not constant, and varies with the maximum velocity of a galaxy (cf. Figure 2). For a number of galaxies the fits may well break down at larger radii if more sensitive HI data become available.
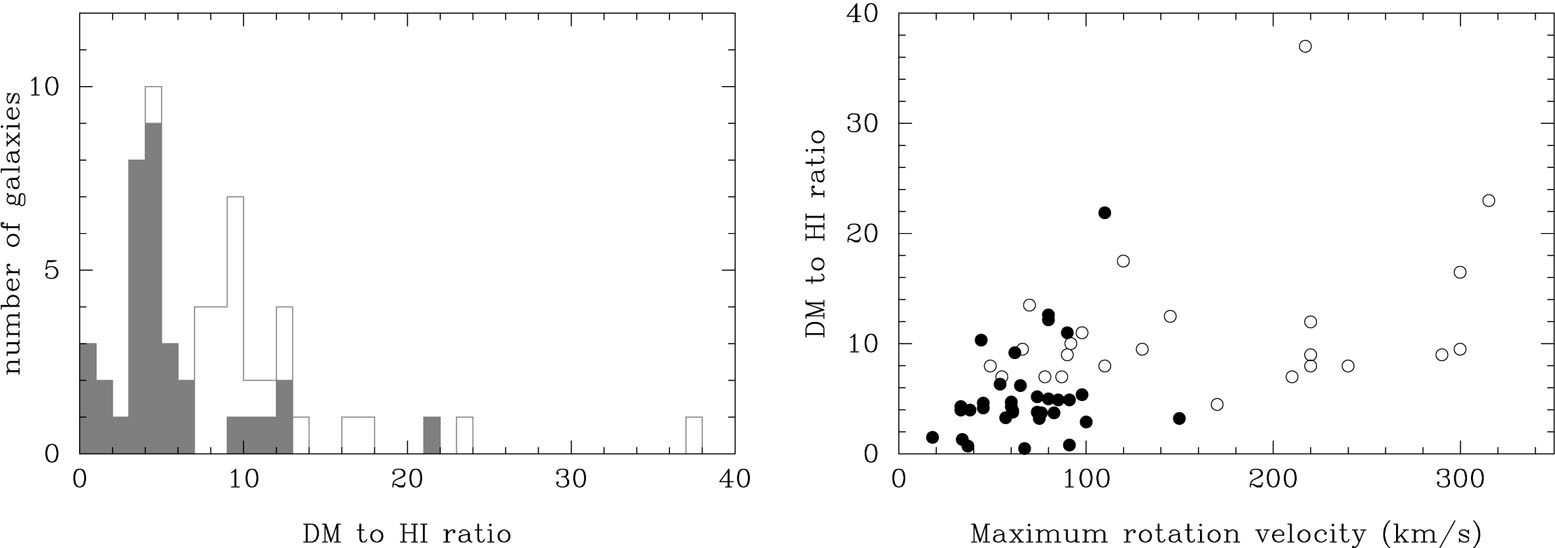 |
Figure 2. HI component scaled as "dark halo" : a) histogram of the scaling factor, b) scaling factor vs. Vmax. Based on data from Hoekstra et al. (2001) (blank part of histogram, open circles), and Swaters (1999) (filled part of histogram, filled circles) |