


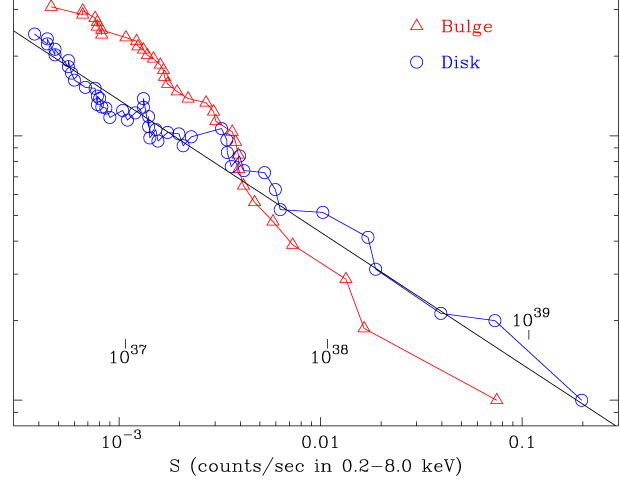
Populations of discrete X-ray sources in different galaxies and different galactic environments (bulge, disk, spiral arms, etc.) have different morphologies for their luminosity distributions (Fig. 3). It has been suggested that the slope and the break are indicative of the star-formation history (Wu 2001): an unbroken power-law indicates continuous star formation; a break (ie, a lack of bright sources) may be caused by aging of the X-ray source population, indicating the look-back time to the last major episode of star formation. This in turn provides information on the dynamical history of a galaxy, because star formation is often triggered by close encounters and mergers with other galaxies.
 |
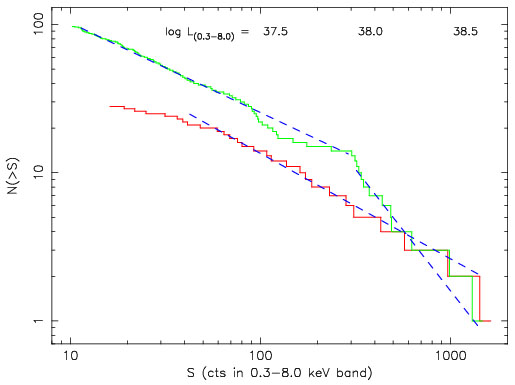 |
Figure 3. Left: the cumulative
luminosity distribution of the discrete sources in M81 shows a break at
L |
|
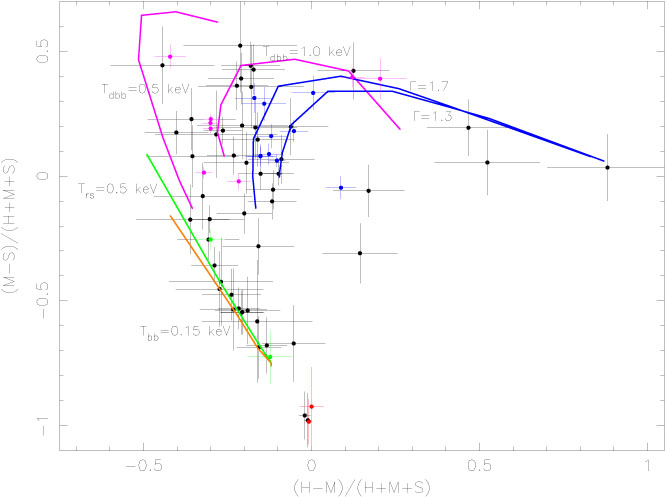
Color-color plots can separate different classes of X-ray sources, and distiguish XRBs in the soft and hard state (Fig. 4). XRBs are, in turn, a mixture of young (timescale of ~ 107 yr after star formation), wind-accreting, high-mass XRBs (generally seen through higher intrinsic absorption), and old (timescale of ~ 109 yr after star formation), Roche-lobe accreting low-mass XRBs. For Galactic sources, the color and spectral separation between the hard and soft state is generally larger in XRBs with a BH accretor than in those with a NS.
 |
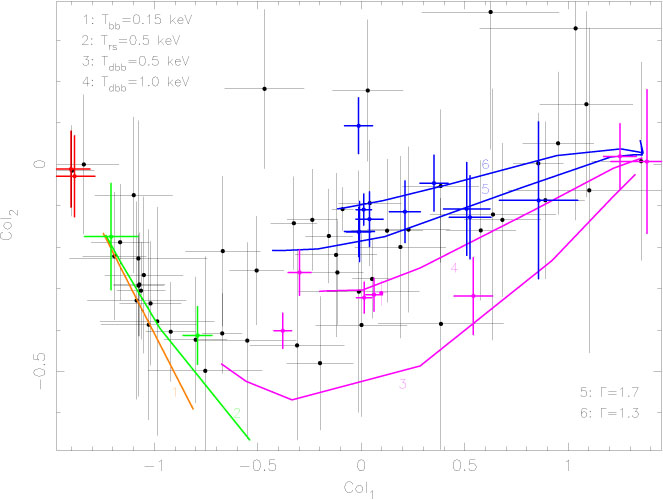 |
Figure 4. Left: The model
lines in the X-ray color-color diagram constrain the expected
locations (for 4 × 10²⁰
|
|
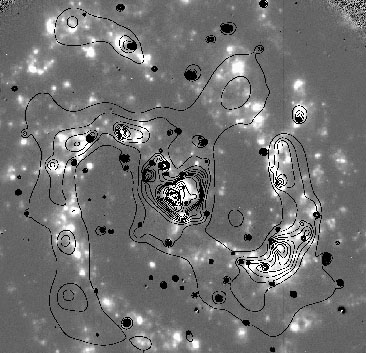
Studies of luminosity and color variability offer another criterion to separate XRBs (which often show state transitions) from SNRs (which do not). The age of different classes of X-ray sources can be inferred from a study of their spatial correlation with various indicators of recent star formation, eg, the spiral arms defined by the HII regions (Fig. 5).
 |
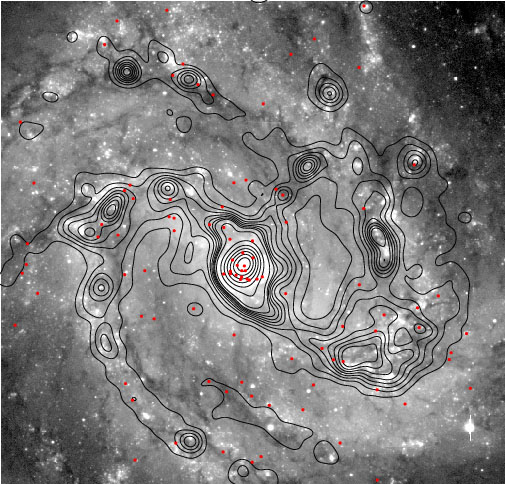 |
Figure 5. Left: the
diffuse X-ray emission (0.3-8.0 keV Chandra contours)
is associated to the spiral arms and is an indicator
of recent star formation, similar to the
H |
|
 3 ×
1037 erg s-1, suggesting
that bulge sources belong to a much older population;
continuous star formation in the disk
results in an unbroken power-law instead
(
3 ×
1037 erg s-1, suggesting
that bulge sources belong to a much older population;
continuous star formation in the disk
results in an unbroken power-law instead
( nH
nH 

 (CH +
CM) / 21/2, Col2
(CH +
CM) / 21/2, Col2
 emission
(greyscale image from the Anglo-Australian Telescope).
Right: Most of the discrete X-ray sources (red circles)
are associated with star-forming regions or young stellar populations
(greyscale VLT B-band image, tracing OBA stars).
The radio flux (12 cm contours from a VLA image)
is a combination of free-free and synchrotron emission
and is also an indicator of star formation.
Size of both images: 6' × 6'. North is up, East is left.
emission
(greyscale image from the Anglo-Australian Telescope).
Right: Most of the discrete X-ray sources (red circles)
are associated with star-forming regions or young stellar populations
(greyscale VLT B-band image, tracing OBA stars).
The radio flux (12 cm contours from a VLA image)
is a combination of free-free and synchrotron emission
and is also an indicator of star formation.
Size of both images: 6' × 6'. North is up, East is left.