


4.3. Relative Velocities, Separations, and the Type of Orbital Motion
To determine the character of the orbital motions of double galaxies we examined the distribution of pairs according to mass estimates, i.e., according to the combination of observed quantities y2X. Another possibility involves the investigation of the dependence of the mean velocity difference of the galaxies in a pair on their projected linear separation <y| X>. The question of the form of the basic regression moments < yk| X > for circular and radial motion was examined by Zonn (1968), Karachentsev (1970b, 1981d) and Noerdlinger (1975). This work will be reviewed very briefly.
1. Circular motion.
Relations (4.1) through (4.3) allow one to determine
the observed quantities y and X from the total pair mass
M12, the
spatial separation r, and the orientation angles i and
 , knowing the form
of the distribution (4.4). For all pairs, the quantities
M12, r, i, and
may be
viewed as independent random variables.
Therefore, the probability distribution of observed quantities is
, knowing the form
of the distribution (4.4). For all pairs, the quantities
M12, r, i, and
may be
viewed as independent random variables.
Therefore, the probability distribution of observed quantities is
 |
(4.26) |
where p(r) and p (M12) are the density distributions of pairs according to spatial separation and total mass of the components, and r* = [GM12 X2 / y2]1/3. According to the calculated regression of the k-th order
 |
(4.27) |
From this, after some straightforward algebra, we obtain regressions for the first and second orders:
 |
(4.28) (4.29) |
where the density p (r) follows from the observed distribution p (X) by means of the Abell inversion
 |
(4.30) |
In the special case in which all pairs have orbits of the same radius, the regression takes a linear form
 |
2. Radial motion. We have from the energy integral for two massive particles
 |
(4.31) |
where l is the oscillation amplitude for the components of
the pair. Introducing the concept of an oscillation phase,
z  r/l we may re-write (4.31) as
 |
Then, for the observed quantities we have the transformations
 |
(4.32) |
where  indicates the
angle between the line of sight and the line connecting the components.
We now introduce the simple assumption that the entire group of pairs
is in an equilibrium state of phases of oscillation, and that their
angles of orientation are distributed uniformly and randomly.
Then, the density distributions of z and
are
indicates the
angle between the line of sight and the line connecting the components.
We now introduce the simple assumption that the entire group of pairs
is in an equilibrium state of phases of oscillation, and that their
angles of orientation are distributed uniformly and randomly.
Then, the density distributions of z and
are
 |
(4.33) |
Incorporating the mutual independence of the random values
Z, l,,
M12, and moving from (4.32) to observed quantities, we
may determine the density regression distribution p (y,
X) and inserting this in (4.28) we would have the regression
<y| X>.
The expression in this case for the regression is rather cumbersome.
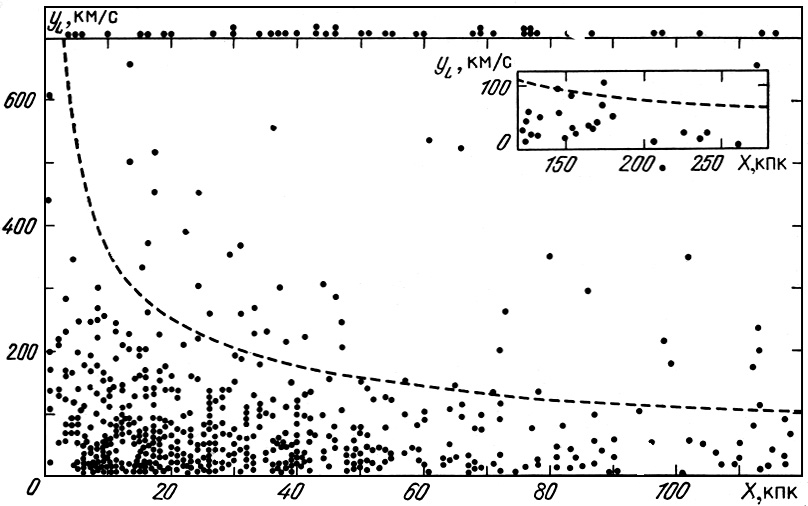 |
Figure 24. |
We note that the regression method may be applied to the catalogue of double galaxies. The observational material is shown in figure 24. In order to apply the data on radial velocity differences uniformly to both giant and dwarf galaxies, we employ the radial velocity difference
 |
(4.34) |
which is normalised to the total luminosity of the pair L. The distribution of double galaxies in yL and X is shown by the points. The inset in the figure shows the distribution for wide pairs. The dashed line shows the location of the critical value f* = 100 separating physical and false pairs. Along the upper margin of the figure are shown the double systems for which the normalised radial velocity difference exceeds 700 km/s (as before, these are optical pairs).
Calculation of the regression <yL| X> for circular and radial motions was carried out with Monte Carlo techniques. Originally for the observed moments <Xk> we calculated moments of the spatial separation <rk> for the case of circular orbits, or moments of the amplitude <lk> for radial motions. We used the obvious relation
 |
(4.35) |
where  (k) is
the gamma-function.
Further, in calculating the moments, analytical expressions for the
functions p (r) and p (l ) were applied.
Finally, a computer was used to generate the observed quantities
y and X
on the basis of the independence of the random variables
(r, i,
) or
(l, , z),
since we know the distribution functions.
(k) is
the gamma-function.
Further, in calculating the moments, analytical expressions for the
functions p (r) and p (l ) were applied.
Finally, a computer was used to generate the observed quantities
y and X
on the basis of the independence of the random variables
(r, i,
) or
(l, , z),
since we know the distribution functions.
The results of performing the mutual regression with 9,000 trials are presented in figure 25. The connected point-to-point lines show the mean values of the modulus and radial velocity difference in steps of 0.1 in <X>. The dispersion gives an estimate of the statistical accuracy of the regression arising for large values of X from the small sample size in the tail of the distribution. In the region with values X > 0.1, the regression for circular motion was systematically higher than for radial motion. The observed data for 487 pairs with f < 100 are shown in figure 25 as diamonds, the height of which indicates the standard deviation in the mean. These data incorporate a correction for errors in measurement of radial velocities.
 |
Figure 25. |
From comparison of the calculated regressions with the observed, we conclude that the proposed circular motion of double galaxies is satisfied with high probability. This is in agreement with the results of the analysis described in the previous paragraph. However, we do not view this regression analysis as sufficiently powerful to determine the type of orbital motion. We base this on the fact that the regressions for the extreme types of motion differ only slightly. On the other hand, it is possible we are dealing with unknown factors which systematically change the form of the regression. Having a control sample of model pairs selected with the aid of exactly the same isolation criterion as for the real pairs, we also calculated the regression <yL| X> for them. Note that this control sample satisfies the condition for random motion in which the vectors V and r are not correlated. Yet the model pairs show a no less marked decrease in mean velocity difference on passing from tight to wide pairs. The regression for the M-pairs is shown in the same units in the upper right inset in figure 25.
Supplementary analysis was performed to clarify the origins of this effect. From the selection criteria (section 3.6), the luminosities of double galaxies exhibit a correlation with linear separation, which will enter into the regression on going from y to yL according to (4.34). Another source may be the increased probability of including in a sub-sample false pairs satisfying the basic criterion f < 100. The very closest among these appear to be members of groups with large virial velocity differences.
Correcting the observed regression for the recognised selection effects results in it becoming closer to the theoretical regression for circular orbits and suggests a situation of `super circularity' for the motion in pairs. These conclusions may be reconciled if one assumes that the actual absolute errors in radial velocity measurements are typically 1.4 times higher than the internal errors (section 2.3).