


3.5. Distribution of Apparent Magnitudes
We now examine the question of what the selection criteria do with regard to apparent magnitudes. Analysis of the catalogue samples is simplified if the selection principles for pairs operate in the same way for nearby as well as for distant objects.
Figure 11 presents the integrated apparent magnitude distribution for galaxies located in pairs. The filled circles show the catalogue galaxies (K-pairs), the open circles, members of the model pairs satisfying the same isolation criteria, and the straight line shows the distribution N ~ 100.6m. As we have seen, the galaxies in K-pairs and M-pairs have almost identical distributions, NK ~ 100.43m and NM ~ 100.42m, with characteristic systematic departures for magnitudes greater than 13 - 14m. This departure from a single distribution apparently originates when both components of a pair are falsely assigned magnitudes too bright because of photometric errors near magnitude 15.7.
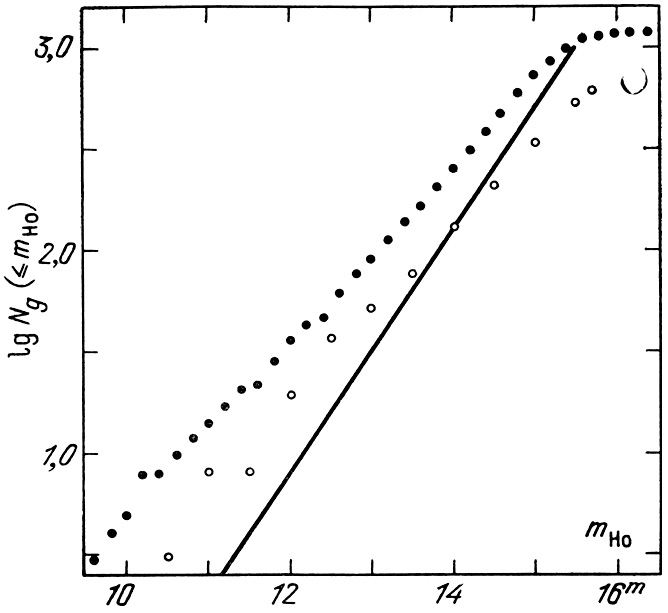 |
Figure 11. |
It is useful to remember here that the catalogue contains 184 `contact' pairs for which the CGCG lists only integrated apparent magnitudes, and to which we assigned individual magnitudes according to (2.11). Of these, 45 galaxies had mHo > 15.7m. These serve to flatten the distribution N(mHo) in the upper part of figure 11. The distribution of the number of double galaxies according to apparent magnitude mHoc, corrected for the effects of obscuration according to (2.15), is shown in an analogous distribution in figure 11. The mean correction for absorption is
 |
Some differences in the distributions of bright catalogue and model pairs are due to the effect of the local supercluster. This is shown in the data of figure 12, which shows the integrated distribution of the numbers of pairs, both components of which are brighter than some fixed apparent magnitude mHo. The symbols for K-pairs and M-pairs are the same as for figure 11. Among the bright double systems in the catalogue, we find a monotonic distribution for objects brighter than 13.7m. Incorporating information on the radial velocity of the galaxies it is easy to convince oneself that more than half of these bright pairs are members of the local supercluster. In the interval [13.7m - 15.5m], the number of pairs rapidly approaches the expected form. Because of the non-uniform assignment of apparent magnitudes in various volumes of the CGCG and the role of merging double systems, the catalogue may be considered complete only to magnitude 15.5, whereas it is 89% complete at magnitude mHo = 15.7m.
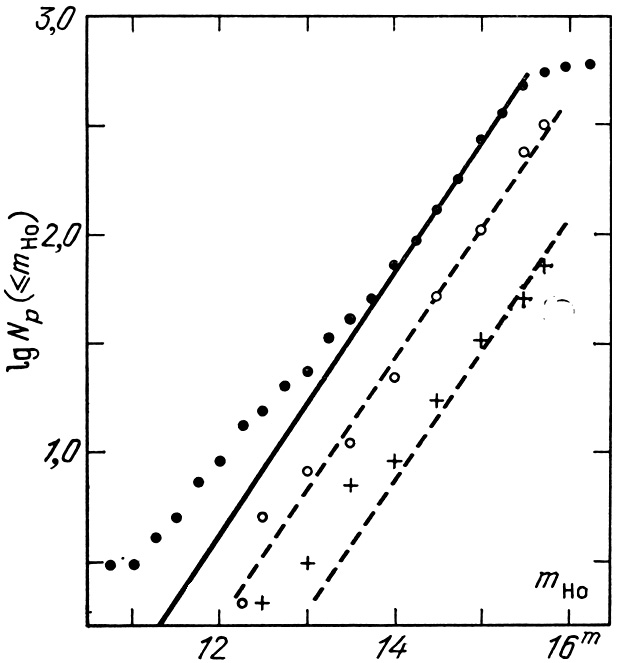 |
Figure 12. |
The distribution of model pairs agrees very well with that expected for single galaxies, shown as the dashed line, but a weak selection in magnitude due to the isolation criterion can be shown. In figure 12 the crosses show the distribution of the number of M-pairs which do not satisfy the basic isolation criterion. Among bright pairs the number satisfying the criterion is somewhat higher than in the sample as a whole.
The condition for pairs of galaxies to be included in the catalogue
exhibits substantial selection in the magnitudes of both components.
In modelling the apparent distribution of galaxies we incorporated the
simple assertion that the absolute magnitudes of both components of a
pair were mutually uncorrelated.
From the luminosity function (3.2), the number of pairs entering into a
sample in which both components are brighter than magnitude 15.7 should
be only 11.7% of the number of pairs satisfying the same photometric
limit for one component.
From the very strong selection, completely ignoring for the moment any sort
of isolation criterion, it is possible to see that there is a powerful limit
to estimates of the spatial abundance of double galaxies,
 , from their catalogue
number
*,
if the magnitudes of galaxies in pairs are not in fact uncorrelated.
, from their catalogue
number
*,
if the magnitudes of galaxies in pairs are not in fact uncorrelated.
To perform this interesting comparison the distribution of K-pairs and M-pairs was formed according to the difference in apparent magnitudes of the components. These data are presented in Table 6. Just as before, we distinguish the number of physical pairs (p), members of systems (s), and optical pairs (o). In the final column we present the number of physical M-pairs not satisying the isolation criteria (N). The bottom line in Table 6 is the mean value of the difference of apparent magnitude and its standard deviation for every sub-sample of double galaxies. Figure 13 displays the distribution of 585 pairs from the catalogue (filled circles) and 301 model pairs (open circles) according to the difference of the apparent magnitudes of the components. The vertical lines indicate standard deviations.
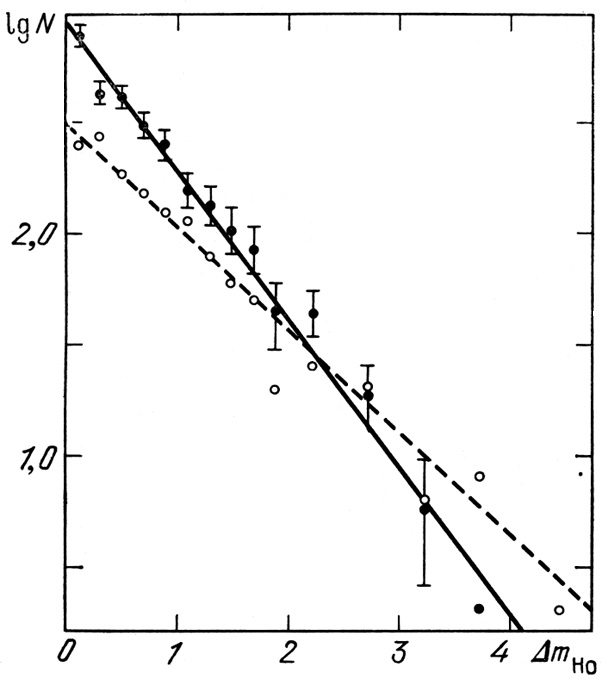 |
Figure 13. |
Both distributions may be described by an exponential form
 |
(3.9) |
with parameters cK = 0.67 for K-pairs and cM = 0.47 for M-pairs. These respective expressions are shown in figure 13 as straight lines. Comparison of these data shows that pairs with a small difference of apparent magnitude are encountered much more often in the catalogue than in the model pairs. This difference comes from several factors.
1. The model pairs, with luminosity function (3.2), have a distribution
N( m)
which can be described by (3.9) with c = 0.40
(the sub-sample P+N of Table 6).
The isolation criterion produces the weak tendency to exclude pairs with a
large difference in magnitude, so that for isolated physical pairs (p), the
value of c is somewhat larger than 0.42.
This weak selection effect on
m is apparent by
comparison of the middle and lower lines of Table 6.
m)
which can be described by (3.9) with c = 0.40
(the sub-sample P+N of Table 6).
The isolation criterion produces the weak tendency to exclude pairs with a
large difference in magnitude, so that for isolated physical pairs (p), the
value of c is somewhat larger than 0.42.
This weak selection effect on
m is apparent by
comparison of the middle and lower lines of Table 6.
2. Members of systems of galaxies (s) and optical pairs (o) have on the
average a smaller difference in apparent magnitude than do members of
physical pairs.
This result, at first glance rather strange, may be explained by the fact
that the basic isolation criterion is usually satisfied by the brightest
members in groups and clusters with
m1  m2 when the other
members of the system are located below the photometric limit of the
catalogue.
As may be easily shown, optical pairs should follow the distribution (3.9)
with c = 0.6 and a mean
<m> =
log e / 0.6 = 0.72m,
which agrees to within expected random errors with the sample
mean 0.83m ± 0.15m in
Table 6.
Also, summing the distributions of optical pairs and group members changes
the value of c in (3.9) from 0.42 to 0.47.
m2 when the other
members of the system are located below the photometric limit of the
catalogue.
As may be easily shown, optical pairs should follow the distribution (3.9)
with c = 0.6 and a mean
<m> =
log e / 0.6 = 0.72m,
which agrees to within expected random errors with the sample
mean 0.83m ± 0.15m in
Table 6.
Also, summing the distributions of optical pairs and group members changes
the value of c in (3.9) from 0.42 to 0.47.
3. If one excludes from the 585 catalogue pairs 184 merging double systems,
and pays attention to extinction, then for this sample (401 pairs in the
third line of Table 6),
<
mHoc> = 0.59m ±
0.03m, which corresponds to (3.9) with c = 0.71.
Finally, the improvement in photometric uniformity of the data produces in
itself the selection of an increased number of catalogue pairs with very
close component magnitudes.
From an examination of the data it is possible to conclude with certainty
that galaxies in double systems exhibit a tight correlation in luminosity.
The roles of false pairs, selection criteria, and photometric nonuniformity
that we have discussed serve to accentuate this tendency.
After accounting for the above-discussed systematic effects, the
distribution
N(m)
for the catalogue pairs has a markedly greater decrement
(c = 0.71) than for the model pairs (c = 0.40),
where the luminosities of the galaxies have been combined.
The observed kinship of double galaxies in absolute magnitude has also been
remarked by
van Moorsel (1983).
Studying a sample of 225 pairs from our catalogue,
Arakelyan (1983a)
constructed
the bivariant luminosity function for components of double systems.
From the data collected in his table, the correlation
coefficient between absolute magnitudes of double galaxies is 0.94.
A corroborating result was presented by
White and Valdes (1980).
According to their study, the distribution
N(m)
in a sample of 63 pairs from the work of
Turner (1976a)
was much more peaked
than expected for chance combinations of galaxies in pairs.
Further clarification of these matters awaits a satisfactory analysis.
In chapter 5 we will present further information showing that the observed resemblance of pairs is not limited merely to their luminosities but extends as well to other characteristics of the galaxies.