Copyright © 1998 by Annual Reviews. All rights reserved
| Annu. Rev. Astron. Astrophys. 1998. 36:
267-316 Copyright © 1998 by Annual Reviews. All rights reserved |


3.1. Redshift Evolution of the Lyman Alpha Forest
In an individual QSO line of sight, observations of the high redshift
(z ~ 3) Ly forest can
extend over a redshift range
forest can
extend over a redshift range
 z greater than
unity. Then we are sampling a significant
fraction of a Hubble time, and it is natural to expect to see changes
in the absorption pattern, e.g., in the rate of incidence of absorption
lines with redshift, or in the mean optical depth.
z greater than
unity. Then we are sampling a significant
fraction of a Hubble time, and it is natural to expect to see changes
in the absorption pattern, e.g., in the rate of incidence of absorption
lines with redshift, or in the mean optical depth.
EVOLUTION OF THE LINE DENSITY
An analytic expression
(Wagoner 1967,
Bahcall & Peebles 1969)
can be given for the number of
absorption systems per unit redshift,
d / dz, in terms
of the
comoving number density n0(z) of absorbers, the
geometric absorption
cross section
/ dz, in terms
of the
comoving number density n0(z) of absorbers, the
geometric absorption
cross section  (z),
and the Hubble constant H0:
(z),
and the Hubble constant H0:
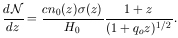
| (6) |
For absorbers with no intrinsic evolution,
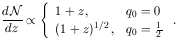
| (7) |
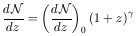
The transformation from redshift z to the coordinate
X(z) =
 0z(1 + z)-1 (1 +
2q0z)1/2 dz
(Wagoner 1967)
is sometimes used to take out the mere cosmological redshift dependence,
such that d / dX =
cn0(z)
(z)
H0-1.
0z(1 + z)-1 (1 +
2q0z)1/2 dz
(Wagoner 1967)
is sometimes used to take out the mere cosmological redshift dependence,
such that d / dX =
cn0(z)
(z)
H0-1.
Peterson (1978)
first pointed out an increase in the number of
Ly clouds with redshift
beyond what was expected for a
populations of non-evolving objects. At first this result was subject
to some debate (see the summary by
Murdoch et al. 1986),
but it is now
clear that the Ly forest as
a whole evolves quite strongly with
z. The observationally determined evolution in the number of
absorbers above a certain column density threshold is usually expressed
in the form
| (8) |
(Sargent et al 1980;
Young et al 1982b),
where the
exponent includes the cosmological dependence. Much observational
effort has been devoted to studying the redshift number density
evolution, but unfortunately the resulting conclusions are far from
robust. This is because Ly
cloud column densities N are distributed according to a power law
N - with index
~ 1.5 (see below) so the
majority of lines
in any column density limited sample are always close to the threshold,
and small variations in imposing the threshold can cause large changes
in the estimated numbers of lines, and in
with index
~ 1.5 (see below) so the
majority of lines
in any column density limited sample are always close to the threshold,
and small variations in imposing the threshold can cause large changes
in the estimated numbers of lines, and in
 . Moreover, line
blending, and its dependence on spectral resolution, data quality, and
redshift can make a large difference in the normalization
(d /
dz)0, with individual studies differing by a factor of
two or more (the interested reader may refer to
Parnell & Carswell
1988;
Liu & Jones 1988;
Trevese et al 1992,
and Kim et al 1997
for a discussion of
blending effects). Each individual study has a finite redshift range
available so that the uncertainty in the normalization is correlated with
the exponent ; the
differences between the observed values
of exhibit a disturbingly
large scatter. Thus the line counting
approach is unsatisfactory when it comes to redshift evolution.
Rather than discussing the many individual (and sometimes
mutually inconsistent) contributions made to this question we will outline
some typical results as follows.
. Moreover, line
blending, and its dependence on spectral resolution, data quality, and
redshift can make a large difference in the normalization
(d /
dz)0, with individual studies differing by a factor of
two or more (the interested reader may refer to
Parnell & Carswell
1988;
Liu & Jones 1988;
Trevese et al 1992,
and Kim et al 1997
for a discussion of
blending effects). Each individual study has a finite redshift range
available so that the uncertainty in the normalization is correlated with
the exponent ; the
differences between the observed values
of exhibit a disturbingly
large scatter. Thus the line counting
approach is unsatisfactory when it comes to redshift evolution.
Rather than discussing the many individual (and sometimes
mutually inconsistent) contributions made to this question we will outline
some typical results as follows.
At lower resolution (FWHM ~ 50-100 kms-1) large samples of lines
have been used to investigate this topic. The
values tend to
lie between the low value
= 1.89 ± 0.28
obtained by
Bechtold (1994),
(W > 0.32 Å), and the high one
= 2.75 ± 0.29 (for
W > 0.36 Å) from the study by
Lu et al (1991).
High resolution spectra, usually confined to z > 2, tend to
give an equally wide range of values:
= 1.7 ± 1.0 (W
> 0.2 Å;
Atwood et al 1985);
2.9 ± 0.3 (2 < z < 4.5;
Cooke et al. 1997);
= 2.78 ± 0.71
(logN > 13.77; 2 < z < 3.5;
Kim et al 1997).
At z > 4 the evolution appears to be accelerating, with
increasing
from a value just below 3 to 5.5
(Williger et al 1994).
EVOLUTION OF THE MEAN ABSORPTION
Similar numbers are obtained by methods which do not depend on line
counting. For 2.5 < z < 4.5,
Press et al (1993),
measuring
 eff(z), derived
= 2.46 ± 0.37.
Zuo & Lu (1993),
deriving DA from spectra reconstituted from published
absorption line lists, find
= 2.87 ± 0.23, but
they considered a broken power law with
= 2.82 below and 5.07
above z = 3.11 to give a better fit, which is
in agreement with an upturn at the highest redshifts. The evolution of
the mean absorption
eff or
DA is indeed a more robust
measure of change, but its relation to the number of clouds is not
entirely straightforward as a model has to be relied on for the
distribution of absorbers,
eff(z), derived
= 2.46 ± 0.37.
Zuo & Lu (1993),
deriving DA from spectra reconstituted from published
absorption line lists, find
= 2.87 ± 0.23, but
they considered a broken power law with
= 2.82 below and 5.07
above z = 3.11 to give a better fit, which is
in agreement with an upturn at the highest redshifts. The evolution of
the mean absorption
eff or
DA is indeed a more robust
measure of change, but its relation to the number of clouds is not
entirely straightforward as a model has to be relied on for the
distribution of absorbers,
 (N, b,
z),the functional form of
which is a priori unknown. Although usually not taken into account, there
clearly is mutual dependence of N, b,
and z in the form of clustering, and of
differential evolution in N and b. Moreover, the column
density of
the lines dominating the absorption changes with redshift (at z ~ 3
lines with logN(HI) ~ 14 contribute most), and so does the
range of column densities to which the measurements of
eff are most
sensitive.
(N, b,
z),the functional form of
which is a priori unknown. Although usually not taken into account, there
clearly is mutual dependence of N, b,
and z in the form of clustering, and of
differential evolution in N and b. Moreover, the column
density of
the lines dominating the absorption changes with redshift (at z ~ 3
lines with logN(HI) ~ 14 contribute most), and so does the
range of column densities to which the measurements of
eff are most
sensitive.
To the surprise of many the first studies with HST of
low redshift (z < 1.5)
Ly lines
(Morris et al 1991;
Bahcall et al 1991,
1993;
Impey et al 1996)
(see also the paragraph on the low
z Ly forest below) have
discovered more absorption systems than
expected from a naive extrapolation of any of the high z power law
exponents. Moreover, the low
= 0.48 ± 0.62 valid
from z ~ 0 to z ~ 1 gives a
d / dz that is
consistent with a
constant comoving density of objects. Accordingly, single power law
fits attempting to explain both high and low z absorbers fail
to account for the rapid upturn around z ~ 1 (e.g.,
Impey et al 1996).
DIFFERENTIAL EVOLUTION AS A FUNCTION OF LINE STRENGTH
A number of authors have made the case for differential
evolution, as a function of column density or equivalent width. At the
high column density end, Lyman limit systems (log N > 17) were
found to be consistent
(Lanzetta 1988;
Sargent et al 1989)
with a non-evolving population at least out to z = 2.5. Therefore
the lower column density systems must be evolving faster, given the above
values.
Murdoch et al. (1986)
and Giallongo (1991)
noted a general tendency toward for slower evolution of
with increasing W
threshold, which could provide continuity between the large
for the general line
population and the
non-evolving, optically thick Lyman limit regime. However, other
studies claim the opposite trend.
Bechtold (1994)
found that
increased from 1.32 ± 0.24 (for weaker lines (W > 0.16
Å) to 1.89 ± 0.28 for strong lines (W > 0.32
Å), Similar conclusions are reached by
Acharya & Khare (1993).
Bechtold's weakest lines
(0.16 < W < 0.32 Å) are consistent with no evolution
all, a result in agreement with the Keck study by
Kim et al (1997).
The latter group, and
Giallongo (1991)
based their conclusions on high resolution data,
whereas the other papers cited are based on low resolution. Blending
cannot be the whole explanation, since the present discrepancy persists
regardless of resolution.
CONCLUSIONS
We may summarize the more secure results on number evolution
as follows:
Going from z = 0 to z ~ 1 there is no obvious change in the
comoving number of the clouds. Then between 1 < z < 2 a
steep rise sets in, which can be
reasonably described by a power law
(1 + z)
with index 2 < < 3. At
redshifts approaching z ~ 4, the upturn appears to steepen
further. Thus a single power law does not fit the curvature of the
d / dz vs. z
relation well. Differential evolution, with stronger lines evolving
less rapidly must exist to reconcile the large
for most of the
forest lines with the non-evolving population of Lyman limit absorbers.
Some studies suggest that the line density at the very low column
density range does not evolve much either, in which case the rapid
evolution inbetween is caused either by a genuine, rapidly changing
sub-population, or by biases in the analysis which we do not understand
properly. In any case, the average optical depth is evolving
strongly with
eff
 (1 +
z)+1 and
around 2 - 3 (for
(1 +
z)+1 and
around 2 - 3 (for
 3).
3).