


5.3. Emission-Line Transfer Functions
While existing AGN monitoring data have been of sufficient quality and quantity to obtain cross-correlation lags, recovery of transfer functions has, not surprisingly, proven to be far more difficult. Existing transfer function solutions tend to be very noisy and ambiguous.
In Fig. 36, we show a sample transfer
function for the H emission
line in NGC 5548;
this transfer function is based on data extending
over more than a crossing time, so the reader is
cautioned against concluding too much from this example,
since it is based on data that span a long interval
compared to the BLR dynamical time scale
(Eq. (19)).
The structures seen in this transfer function
do not correspond to those seen
in any of the simple models that we have described
earlier. Note in the one-dimensional transfer function
the low amplitude of the response
at zero lag, first noticed even with just the
first year of AGN Watch data
34;
this indicates that there is little response due to material
along our line-of-sight to the continuum source, suggestive
of either a low-inclination disk (i.e., there is little
gas along the line of sight) or anisotropic line response
24.
Whether or not other lines have
small response at small lag is less certain
43,
62;
this effect
may be seen clearly only in H
on account of the large lag.
emission
line in NGC 5548;
this transfer function is based on data extending
over more than a crossing time, so the reader is
cautioned against concluding too much from this example,
since it is based on data that span a long interval
compared to the BLR dynamical time scale
(Eq. (19)).
The structures seen in this transfer function
do not correspond to those seen
in any of the simple models that we have described
earlier. Note in the one-dimensional transfer function
the low amplitude of the response
at zero lag, first noticed even with just the
first year of AGN Watch data
34;
this indicates that there is little response due to material
along our line-of-sight to the continuum source, suggestive
of either a low-inclination disk (i.e., there is little
gas along the line of sight) or anisotropic line response
24.
Whether or not other lines have
small response at small lag is less certain
43,
62;
this effect
may be seen clearly only in H
on account of the large lag.

|
Figure 36. A transfer function for
H |
Fig. 37 shows an attempt to recover the C IV transfer function from 39 daily observations of NGC 5548 made with HST in 1993. These data have been used in several independent analyses 90, 19, 11, 8 with no consensus on the interpretation, and indeed with quite contrary conclusions about the kinematics: Wanders et al. 90 favor no radial motion, Done & Krolik 19 find a hint of radial infall (also previously suggested by Crenshaw & Blackwell 18 on the basis of the first year of IUE data), and Chiang & Murray 11 and Bottorff et al. 8 fit the data with different radial-outflow models.

|
Figure 37. A transfer function for C IV
|
A crude measure of the velocity field might be obtained
by cross-correlating parts of the emission line:
for example, comparison of the response times for the
red and blue wings could be used to detect
radial infall/outflow. Similarly, one could
compare the response times for the line wings with
the line core in an attempt to detect virial
motion, i.e., V  r-1/2.
There have been a number of reports that the
emission lines wings respond faster than
core 13,
as expected for virial motion, but detection is
always weak.
r-1/2.
There have been a number of reports that the
emission lines wings respond faster than
core 13,
as expected for virial motion, but detection is
always weak.
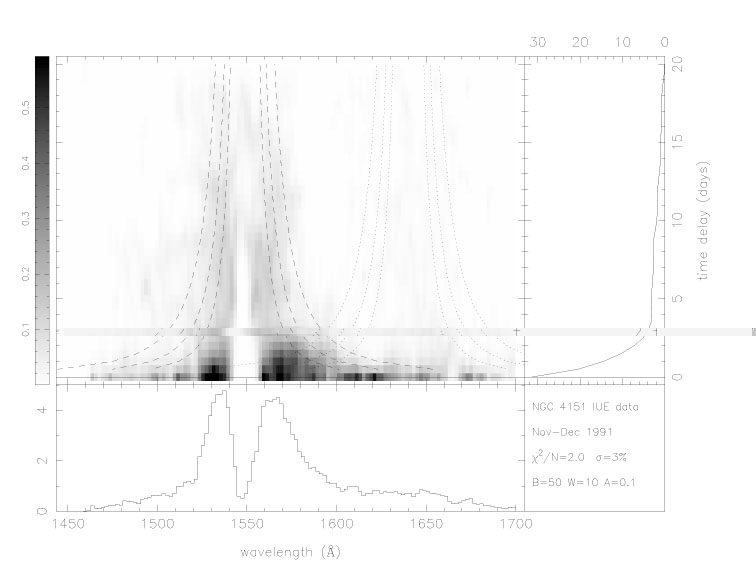
A two-dimensional transfer function for the C IV-He II spectral region in NGC 4151 is shown Fig. 38. Ulrich & Horne 85 argue that there is a hint that the red wing responds slightly more rapidly than the blue wing, which is the expected signature for radial infall.
|
Figure 38. A transfer function for the C IV-He II region of NGC 4151 based on IUE spectra. The strong double-peaked appearance of the C IV line is due to a deep slightly blueshifted absorption feature in this line. From Ulrich & Horne 85 © 1996 Blackwell Sci. |
 1549 in