


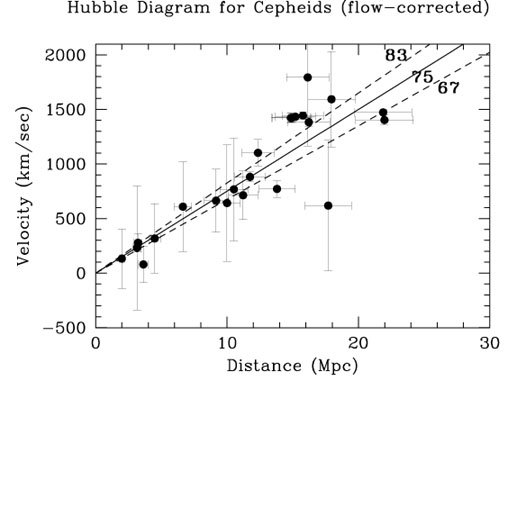
A Hubble diagram for 23 galaxies with Cepheid distances is shown in
Figure 1. The galaxy velocities have been
corrected for the flow field model described above. The error bars in
this plot reflect the difference between the predictions from this
flow field and those of
Tonry et al. (2000).
A fit to the data yields a
slope of 75 ± 10 km s-1 Mpc-1, excluding
systematic errors. As we
shall see in Section 7 below, the scatter
is larger in this
Hubble diagram than for the secondary methods that operate at greater
distances; however, the mean value of H0 for nearby galaxies
is in very good agreement with the distant sample. In
Table 5, we give the uncorrected, heliocentric
velocities
for the Cepheid galaxies, and the velocities as successive corrections
are added: corrections for the Local Group, the Virgo cluster, the
Great Attractor, and the Shapley concentration. The velocities
plotted include all of these corrections. For comparison, we also
list the velocities calculated from the
Tonry et al. (2000)
flow model,
using our Cepheid distances, and assuming H0 = 78 km
s-1 Mpc-1 , and
 m = 0.2, as in
their paper. There are some differences
between the simple flow model that we have adopted and the Tonry et al.
model, most significantly, the Fornax cluster galaxies. Our adopted
triple attractor model yields a quieter flow at Fornax, and reproduces
the cosmic microwave background frame. The agreement for the Virgo cluster, however, is excellent. Again this
comparison demonstrates
the importance of measuring H0 at large distances where
uncertainties in the velocities become unimportant.
m = 0.2, as in
their paper. There are some differences
between the simple flow model that we have adopted and the Tonry et al.
model, most significantly, the Fornax cluster galaxies. Our adopted
triple attractor model yields a quieter flow at Fornax, and reproduces
the cosmic microwave background frame. The agreement for the Virgo cluster, however, is excellent. Again this
comparison demonstrates
the importance of measuring H0 at large distances where
uncertainties in the velocities become unimportant.
|
Figure 1. Velocity versus distance for galaxies with Cepheid distances. Velocities in this plot have been corrected using the flow model described in Mould et al. (2000). The Cepheid distances have been corrected for metallicity. A formal fit to these data yields a slope of H0 = 75 ± 10r km/sec/Mpc, in good agreement, to within the uncertainties, of the value of H0 obtained for methods which extend to much greater distances. |
|