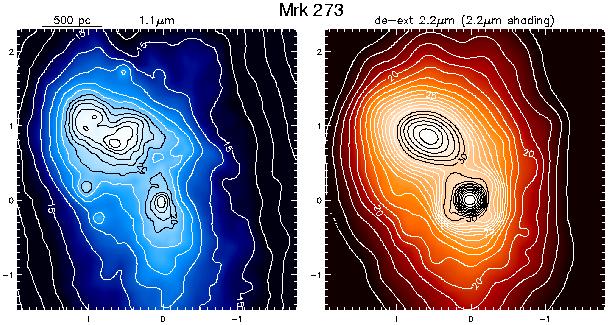
The northern nucleus is both bluer and more spatially extended than the
redder, unresolved southern nucleus.
Both nuclei are much redder than the surrounding galaxy.
The tidal tails may be seen in both the 1.1 µm emission and in
obscuration (2.2/1.1 µm) extending well to the north and
south of the
nuclei. In addition, several bright clusters are seen to the south and
north of the northern nucleus. Optical imaging shows the presence of a
northern tidal loop as well as an edge- on tidal feature to the south
(Sanders et al. 1988a). Additional optical and UV imaging shows the
presence of young star formation in the northern nucleus and in a region
directly to its west (Surace 1998). Knapen et al. (1997) discuss the
relation of their adaptive optics near-infrared data to their radio data.
Surprisingly, they find that the northern nucleus is the strongest radio
source and associate it with the active nucleus which is presumably the
source of the known Sy 2 emission (Sanders et al. 1988a), while they find
the dominant infrared peak (the SW nucleus) to be the location of a
starburst, which is the opposite of what is implied based on the NICMOS
morphology. A near-infrared source SE of the northern nucleus is also
shown which had been known previously (Condon et al. 1991). While Knapen
et al. present this as a background object, the NICMOS data shows it is
spatially coincident with a blue compact object identified as a star
cluster.
Shaded contour plots of the extinction corrected
2.2 µm emission are shown together with the 1.1
µm (upper left)
observed emission. In both panels, the contours and shading are
logarithmic with the contours spaced by factors 21/2. (The level
values are the same as for the figure above). The arcsec displacements
in RA and DEC, given along the borders are measured from the 2.2
µm in
all frames. At the upper left, a length bar is drawn. For the ratio image,
both the 2.2 and 1.1 µm images were smoothed with the same adaptive
smoothing and then smoothed with a Gaussian FWHM = 0.2" in
calculating the 2.2 µm opacity from Eq. 3 (see text). In
cases where a
strong point-source or variable background contaminated the 2.2 µm
image, the extinction corrected image was derived for 1.6
µm. For the
galaxies with strong point-sources, the PSF was fit to the source and then
subtracted and replaced by a Gaussian with the proper integrated flux (see
text - NGC 7469, IRAS 08572+3915, IRAS 05189-2524, PKS 1345+12, IRAS 07598+6508, Mrk 1014 and 3C48).