In IRAS 15250+3609 there is one dominant
nucleus and a much less bright (possible) nucleus 0.7" SE. It is
not clear if this second source is indeed a nucleus or an anomalously
bright cluster but its colors are very red like most of the nuclei in our
sample and it is approximately a factor of ten more luminous than any
other cluster in this system. The emission associated with the primary
nucleus is also extended in the direction of the secondary source. In
addition, the nuclear region is surrounded by several bright star
clusters.
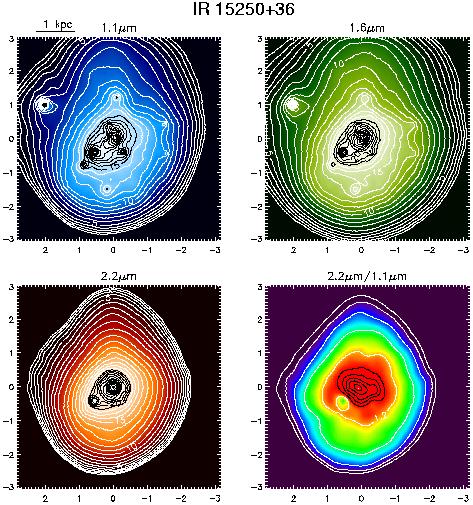
Shaded contour plots of the extinction corrected
2.2 µm emission are shown together with the 1.1
µm (upper left)
observed emission. In both panels, the contours and shading are
logarithmic with the contours spaced by factors 21/2. (The level
values are the same as for the figure above). The arcsec displacements
in RA and DEC, given along the borders are measured from the 2.2
µm in
all frames. At the upper left, a length bar is drawn. For the ratio image,
both the 2.2 and 1.1 µm images were smoothed with the same adaptive
smoothing and then smoothed with a Gaussian FWHM = 0.2" in
calculating the 2.2 µm opacity from Eq. 3 (see text). In
cases where a
strong point-source or variable background contaminated the 2.2 µm
image, the extinction corrected image was derived for 1.6
µm. For the
galaxies with strong point-sources, the PSF was fit to the source and then
subtracted and replaced by a Gaussian with the proper integrated flux (see
text - NGC 7469, IRAS 08572+3915, IRAS 05189-2524, PKS 1345+12, IRAS 07598+6508, Mrk 1014 and 3C48).