
| © CAMBRIDGE UNIVERSITY PRESS 1999
| |


1.7.2 Lessons from Warm Dark Matter
As has been said, the chart in Fig. 1.3 only includes a few of the possibilities. But many possibilities that have been examined are not very promising. The problems with a pure Hot Dark Matter (HDM) adiabatic cosmology have already been mentioned. It will be instructive to look briefly at Warm Dark Matter, to see that some variants of CDM have less success than others in fitting cosmological observations, and also because there is renewed interest in WDM. Although CHDM and WDM are similar in the sense that both are intermediate models between CDM and HDM, CHDM and WDM are quite different in their implications. The success of some but not other modifications of the original CDM scenario shows that more is required than merely adding another parameter.
As explained above, WDM is a simple modification of HDM, obtained by
changing the assumed average number density n of the particles. In
the usual HDM, the dark matter particles are neutrinos, each species
of which has n =
113 cm-3, with a corresponding mass of
m() =
=
113 cm-3, with a corresponding mass of
m() = 
 0/n = 92 h2 eV. In
WDM, there is another parameter, m/m0, the ratio of the
mass of the warm
particle to the above neutrino mass; correspondingly, the number
density of the warm particles is reduced by the inverse of this
factor, so that their total contribution to the cosmological density
is unchanged. It is true of both of the first WDM particle candidates,
light gravitino and right-handed neutrino, that these particles
interact much more weakly than neutrinos, decouple earlier from the
Hot Big Bang, and thus have diluted number density compared to
neutrinos since they do not share in the entropy released by the
subsequent annihilation of species such as quarks. This is analogous
to the neutrinos themselves, which have lower number density today
than photons because the neutrinos decouple before e+e-
annihilation (and also because they are fermions).
0/n = 92 h2 eV. In
WDM, there is another parameter, m/m0, the ratio of the
mass of the warm
particle to the above neutrino mass; correspondingly, the number
density of the warm particles is reduced by the inverse of this
factor, so that their total contribution to the cosmological density
is unchanged. It is true of both of the first WDM particle candidates,
light gravitino and right-handed neutrino, that these particles
interact much more weakly than neutrinos, decouple earlier from the
Hot Big Bang, and thus have diluted number density compared to
neutrinos since they do not share in the entropy released by the
subsequent annihilation of species such as quarks. This is analogous
to the neutrinos themselves, which have lower number density today
than photons because the neutrinos decouple before e+e-
annihilation (and also because they are fermions).
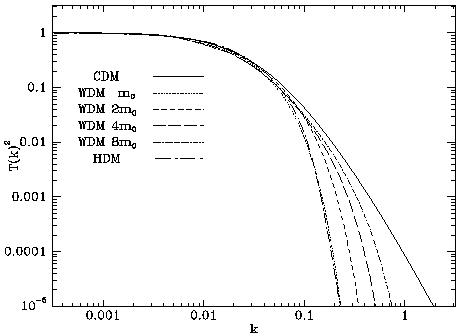
In order to investigate the cosmological implications of any dark matter candidate, it is necessary to work out the gravitational clustering of these particles, first in linear theory, and then after the amplitude of the fluctuations grows into the nonlinear regime. Colombi, Dodelson, & Widrow (1996) did this for WDM, and Fig. 1.4 from their paper compares the square of the linear transfer functions T (k) for WDM and CHDM. The power spectrum P (k) of fluctuations is given by the quantity plotted times the assumed primordial power spectrum Pp(k), P(k) = Pp(k) T(k)2. The usual assumption regarding the primordial power spectrum is Pp(k) = Aknp, where the ``tilt'' equals 1 - np, and the untilted, or Zel'dovich, spectrum corresponds to np = 1.
|
|
Figure 1.4. The square of the linear
transfer function T(k)
vs. wavenumber k = (2 |
One often can study large scale structure just on the basis of such
linear calculations, without the need to do computationally expensive
simulations of the non-linear gravitational clustering. Such studies
have shown that matching the observed cluster and galaxy correlations
on scales of about 20-30 h-1 Mpc in CDM-type theories
requires
that the ``Excess Power'' EP  1.3, where
and as usual
Figure 1.5. The value of the
J3 integral for SCDM and a number of
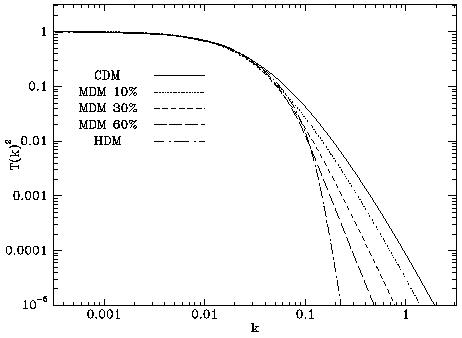
Figure 1.6. Excess power EP in the
two models discussed that
interpolate between CDM and HDM. Solid curve shows EP as a function
of the WDM parameter m/m0; note how quickly it becomes
similar to
CDM. Dashed curve shows how EP for Mixed Dark Matter (MDM - CHDM
with N
Since calculating
the linear calculations shown in Fig. 1.4 immediately
allow determination of EP for WDM and CHDM. The results are shown in
Fig. 1.6, in which the lower horizontal axis
represents
the values of the WDM parameter m/m0 (with
m/m0 = 1 representing the
HDM limit), and the upper horizontal axis represents the values of the
CHDM parameter
Probably the only way to accommodate WDM in a viable cosmological
model is as part of a mixture with hot dark matter
(Malaney,
Starkman, & Widrow 1995),
which might even arise naturally in a supersymmetric model
(Borgani, Masiero,
& Yamaguchi 1996)
of the sort in which the gravitino is the LSP
(Dimopoulos et
al. 1996).
Cold plus ``volatile''
dark matter is a related possibility
(Pierpaoli et
al. 1996);
in these models, the hot component arises from decay of a heavy unstable
particle rather than decoupling of relativistic particles.
There are many more parameters needed to describe the presently
available data on the distribution of galaxies and clusters and their
formation history than the few parameters needed to specify a CDM-type
model. Thus it should not be surprising that at most a few CDM variant
theories can fit all this data. Once it began to become clear that
standard CDM was likely to have problems accounting for all the data,
after the discovery of large-scale flows of galaxies was announced in
early 1986
(Burstein et
al. 1986),
Jon Holtzman in his dissertation research worked
out the linear theory for a wide variety of CDM variants
(Holtzman 1989;
cf. also Blumenthal, Dekel, & Primack 1988)
so that we could see which ones would best fit the data
(Primack &
Holtzman 1992,
Holtzman & Primack
1993;
cf. Schaefer &
Shafi 1993).
The clear winners were CHDM with
 r is
the rms fluctuation
amplitude in randomly placed spheres of radius r h-1 Mpc.
The EP parameter was introduced by
Wright et
al. (1992), and
Borgani et al. (1996)
has shown that EP is related to the spectrum shape parameter
r is
the rms fluctuation
amplitude in randomly placed spheres of radius r h-1 Mpc.
The EP parameter was introduced by
Wright et
al. (1992), and
Borgani et al. (1996)
has shown that EP is related to the spectrum shape parameter
 introduced by
Efstathiou, Bond,
and White (1992)
(cf. Bardeen et
al. 1986)
by
0.5
(EP)-3.3. For CDM and
the
introduced by
Efstathiou, Bond,
and White (1992)
(cf. Bardeen et
al. 1986)
by
0.5
(EP)-3.3. For CDM and
the  CDM
family of models, =
h; for CHDM and other models,
the
formula just quoted is a useful generalization of the spectrum shape
parameter since the cluster correlations do seem to be a function of this
generalized , as shown in
Fig. 1.5. As this
figure shows,
0.25 to match cluster
correlation data.
Peacock & Dodds
(1994)
have shown that
0.25 also is
required to match large scale galaxy clustering data. This
corresponds to EP 1.25.
CDM
family of models, =
h; for CHDM and other models,
the
formula just quoted is a useful generalization of the spectrum shape
parameter since the cluster correlations do seem to be a function of this
generalized , as shown in
Fig. 1.5. As this
figure shows,
0.25 to match cluster
correlation data.
Peacock & Dodds
(1994)
have shown that
0.25 also is
required to match large scale galaxy clustering data. This
corresponds to EP 1.25.
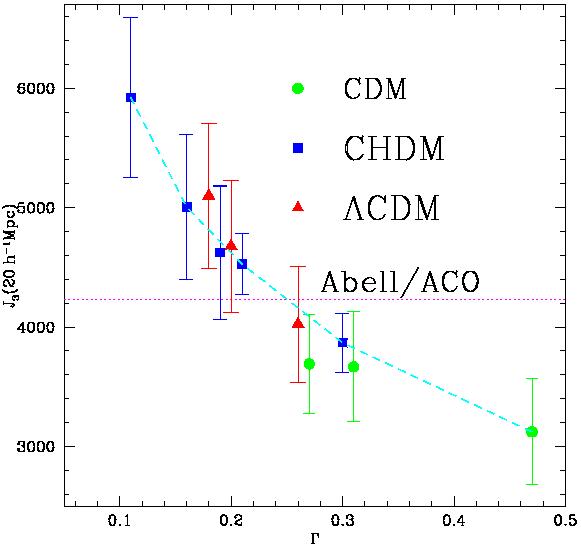
CDM and
CHDM models evaluated at R = 20h-1 Mpc is
plotted against the value of
the shape parameter defined in
the text. As usual, J3(R) =
 0R
0R
 cc(r)r2 dr,
where
cc is the cluster
correlation function. The horizontal dotted line is the
J3 value
for the Abell/ACO sample. The squares connected by the dashed line
correspond from left to right to CHDM with n = 1 neutrino species
and = 0.5, 0.3, 0.2, 0.1, and 0 (SCDM);
the square slightly below the dashed line corresponds to CHDM with
N = 2
and = 0.2; all
these models have = 1,
h = 0.5, and no tilt. The triangles correspond (l-to-r) to CDM with
(0, h) =
(0.3,0.7), (0.4,0.6) and (0.5,0.6). The two
circles on the left correspond to CDM with h = 0.4 and (l-to-r) tilt
(1 - np) = 0.1 and 0. These points and error bars are
from a suite of
truncated Zel'dovich approximation (TZA) simulations, checked by
N-body simulations. (From
Borgani et
al. 1996.)
cc(r)r2 dr,
where
cc is the cluster
correlation function. The horizontal dotted line is the
J3 value
for the Abell/ACO sample. The squares connected by the dashed line
correspond from left to right to CHDM with n = 1 neutrino species
and = 0.5, 0.3, 0.2, 0.1, and 0 (SCDM);
the square slightly below the dashed line corresponds to CHDM with
N = 2
and = 0.2; all
these models have = 1,
h = 0.5, and no tilt. The triangles correspond (l-to-r) to CDM with
(0, h) =
(0.3,0.7), (0.4,0.6) and (0.5,0.6). The two
circles on the left correspond to CDM with h = 0.4 and (l-to-r) tilt
(1 - np) = 0.1 and 0. These points and error bars are
from a suite of
truncated Zel'dovich approximation (TZA) simulations, checked by
N-body simulations. (From
Borgani et
al. 1996.)
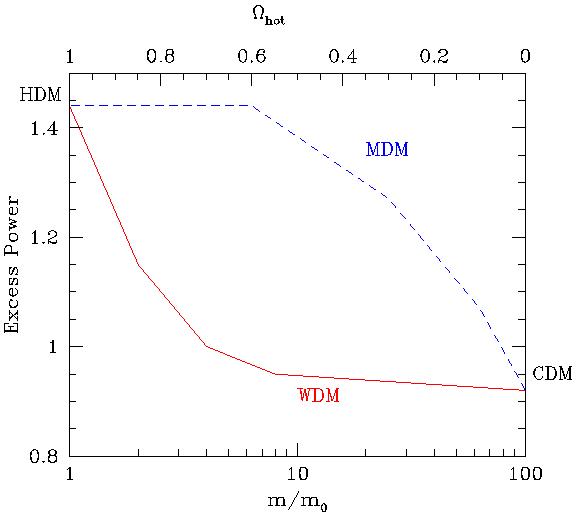
= 1 neutrino
species) depends on . The
observationally preferred value is EP
0.25.
(From Colombi,
Dodelson, & Widrow 1996,
used by permission.)
(r) is
a simple matter of integrating the power
spectrum times the top-hat window function,
 . This figure shows that for WDM to
give the required EP, the parameter value m/m0
1.5-2, while for CHDM
the required value of the CHDM parameter is
0.3.
But one can see from Fig. 1.4 that in WDM with
m/m0
. This figure shows that for WDM to
give the required EP, the parameter value m/m0
1.5-2, while for CHDM
the required value of the CHDM parameter is
0.3.
But one can see from Fig. 1.4 that in WDM with
m/m0
 2, the spectrum lies a
lot lower than the CDM spectrum at k
0.3 h-1 Mpc (length scales
2, the spectrum lies a
lot lower than the CDM spectrum at k
0.3 h-1 Mpc (length scales

 20 h-1
Mpc). This in
turn implies that formation of galaxies, corresponding to the
gravitational collapse of material in a region of size ~ 1 Mpc,
will be strongly suppressed compared to CDM. Thus WDM will not be
able to accommodate simultaneously the distribution of clusters and
galaxies. But CHDM will do much better - note how much lower
T(k)2 is at k
0.3 h
Mpc-1 for WDM with m/m0 = 2
than for CHDM with = 0.3. Actually, as we will discuss
in more detail shortly, CHDM with
= 0.3 turns out, on more careful examination, to have
several defects - too many intermediate-size voids, too few early
protogalaxies. Lowering to about 0.2,
corresponding to a
total neutrino mass of about 4.6(h / 0.5)-2 eV, in a
model in which
N = 2 neutrino
species share this mass, fits all this data
(PHKC95).
0.3
if h 0.5, and
CDM with
0
0.2 if h
1. CHDM had first
been advocated several years earlier
(Bonometto &
Valdarnini 1984,
Dekel & Aarseth 1984,
Fang et al. 1984,
Shafi & Stecker
1984) but
was not studied in detail until more recently (starting with
Davis et al. 1992,
Klypin et al. 1993).
20 h-1
Mpc). This in
turn implies that formation of galaxies, corresponding to the
gravitational collapse of material in a region of size ~ 1 Mpc,
will be strongly suppressed compared to CDM. Thus WDM will not be
able to accommodate simultaneously the distribution of clusters and
galaxies. But CHDM will do much better - note how much lower
T(k)2 is at k
0.3 h
Mpc-1 for WDM with m/m0 = 2
than for CHDM with = 0.3. Actually, as we will discuss
in more detail shortly, CHDM with
= 0.3 turns out, on more careful examination, to have
several defects - too many intermediate-size voids, too few early
protogalaxies. Lowering to about 0.2,
corresponding to a
total neutrino mass of about 4.6(h / 0.5)-2 eV, in a
model in which
N = 2 neutrino
species share this mass, fits all this data
(PHKC95).
0.3
if h 0.5, and
CDM with
0
0.2 if h
1. CHDM had first
been advocated several years earlier
(Bonometto &
Valdarnini 1984,
Dekel & Aarseth 1984,
Fang et al. 1984,
Shafi & Stecker
1984) but
was not studied in detail until more recently (starting with
Davis et al. 1992,
Klypin et al. 1993).
 )/
)/