


6.2. Evolution of X-ray Sources
The Chandra and XMM-Newton observatories are enabling X-ray surveys with sensitivity limits 2 orders of magnitude fainter than was previously possible because of their large collecting areas and exposure times of a million seconds. In the Chandra Deep Field South (Rosati et al. 2002), Figure 4 shows that the surface density of sources is greater than 3000 deg-2. Thus, for the first time, the surface density of the deepest X-ray selected AGNs exceeds the values of a few hundred deg-2 that were achieved in early deep optical surveys. However, it is also now possible to carry out optical imaging and spectroscopic observations for sources that are 2 orders of magnitude fainter than the nominal limit of SDSS, for example. These capabilities have led both to important discoveries and to the opening up of important areas of research.
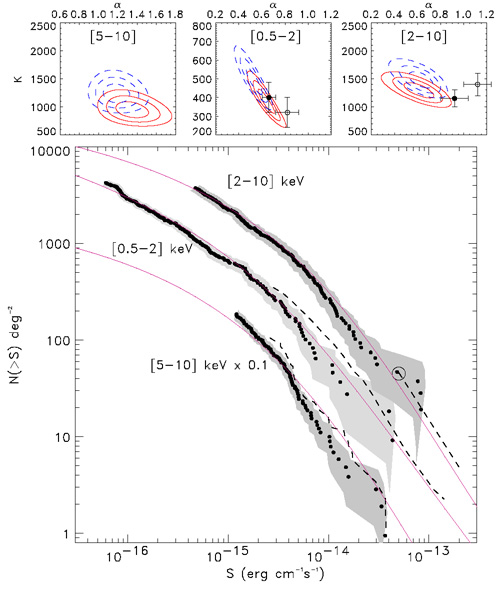 |
Figure 4. The log N-log S
data for the Chandra Deep Field South
survey for three different energy bands. The upper boxes show the
fits for the normalization constant,
|
For example, the deep source counts show that most of the X-ray background (XRB) can be resolved and accounted for by faint discrete sources. However, to match the SED of the XRB requires the existence of a substantial number of absorbed AGNs at relatively low redshifts (e.g., Gilli, Salvati, & Hasinger 2001, building on much previous work, such as that of Setti & Woltjer 1989).
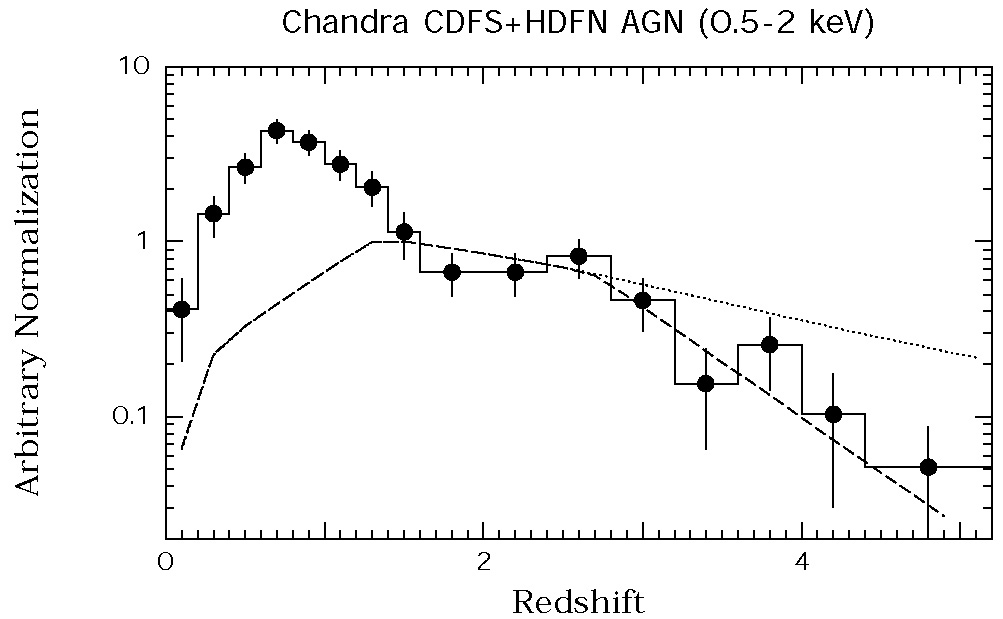
Interestingly, optical identifications and follow-up spectroscopy are now demonstrating the presence of these sources (e.g., Barger et al. 2001; Hasinger private communication), which have generally escaped notice in previous surveys either because of their faintness or their unremarkable optical appearance and spectra. Cowie et al. (2003) and Hasinger (2003) have assembled large enough samples of objects to show clearly the excess of low-redshift AGNs compared to the expectations of the evolutionary fits found for the optical samples described above (Fig. 5). Martini et al. (2002) find an unexpectedly high fraction of X-ray selected AGNs in the cluster Abell 2104, only one of which has the characteristic emission lines of an AGN in its optical spectrum. These studies demonstrate the important power that deep X-ray observations bring to the studies of low-luminosity AGNs.
 |
 |
Figure 5. Left: The redshift distribution for 243 AGNs in the Chandra Deep Field South and Hubble Deep Field North surveys, from Hasinger (2003), compared to population synthesis models by Gilli et al. (2001), where the dashed line is for the redshift decline of SSG for z > 2.7 and the dotted line is for a constant space density for z > 1.5. Note the observed excess of objects at z < 1. Right: Luminosity functions derived from Chandra, ROSAT, and ASCA surveys by Cowie et al. (2003), based on their redshift measurements and estimates. Note that the values for sources with z < 1 and LX < 1043 erg s-1 are well above those for the 2 < z < 4 objects. |
|
Thus, we are making good progress on mapping both the total contribution of AGNs to the X-ray background and the evolution with time of their X-ray emission, which in turn will lead to a measure of the accretion history of discrete sources in the Universe. We may look forward to substantial advances in the next decade as the observational data continue to improve and the physics of accretion is better understood.
 , and slope,
 , of the faint end of
the data
(
, of the faint end of
the data
(