


Combining a suitable set of spectra with evolution models allows the synthesis of spectrophotometric quantities for an assumed population mixture, a concept that dates back to [49]. Such models describe the spectral and chemical evolution of stellar systems in an attempt to derive the properties of a stellar population in both nearby and distant galaxies, whose individual stars are either resolved or unresolved, respectively. A recent summary of the different modeling approaches and results can be found, e.g., in [32] and [2].
The time evolution of the global SED of a single stellar population is shown in Fig. 6 ([51]), whose purpose is to highlight both the dramatic change of the SED with time and how different stellar evolution models affect the predictions. The comparison is performed for the most widely used evolution models by the Geneva [41], original Padova [11], and Padova models extended beyond the asymptotic giant branch (AGB) phase [51]. Young population with ages of 1, 3, 10, 50, and 100 Myr are shown in the left panel. SEDs produced with the Padova tracks are more luminous by up to 0.1 dex at most wavelengths. These differences are the result of higher intrinsic stellar luminosities in the Padova models for post-main-sequence evolutionary phases. There is a striking difference between the SEDs in the UV around 3 Myr. Hot W-R stars when coupled with extended model atmospheres produce the excess emission in the Padova models.
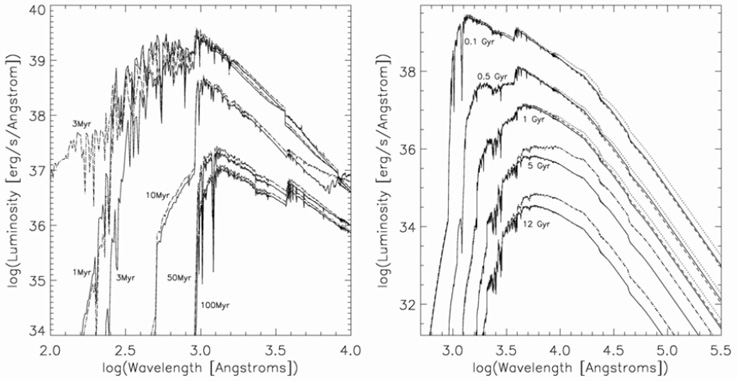 |
Figure 6. Spectral energy distributions for young (left) and old (right) populations with solar composition. Solid: Geneva; dashed: original Padova; dotted: Padova with AGB stars added. The far-UV continuum produced by the Geneva and Padova models at 3 Myr differs dramatically and has been labeled twice for clarity. Note that the Padova and the Padova+AGB models coincide prior to the occurrence of the first AGB stars, producing a "dashed-dotted" graph ([51]). |
Older ages of 0.1, 0.5, 1, 5, and 12 Gyr are reproduced in the right
panel of Fig. 6. The contribution of AGB stars
to the red part of the spectrum is clearly visible. For
models with ages > 1 Gyr (e.g., 5 Gyr), there is a drastic difference
between the Padova and Geneva tracks. The difference results from a
combination of two effects.
First, the Geneva tracks do not include low-mass stars below 0.8
M . Since the
chosen IMF extends down to 0.1
M, the absence
of these stars creates a luminosity deficit, which sets in at an age of
a few Gyr, and becomes progressively stronger. Second, the
implementation of the Geneva tracks in the Starburst99 models used in
Fig. 6 does not include the add-on set published by
[5].
[5]
computed the horizontal-branch evolution
after the He-flash in low-mass stars. Horizontal-branch stars around ~
1.5 M
contribute significantly to the near-IR luminosity, beginning at an age
of ~ 1 Gyr. They are the chief reason for the difference between Geneva
and Padova after that epoch.
. Since the
chosen IMF extends down to 0.1
M, the absence
of these stars creates a luminosity deficit, which sets in at an age of
a few Gyr, and becomes progressively stronger. Second, the
implementation of the Geneva tracks in the Starburst99 models used in
Fig. 6 does not include the add-on set published by
[5].
[5]
computed the horizontal-branch evolution
after the He-flash in low-mass stars. Horizontal-branch stars around ~
1.5 M
contribute significantly to the near-IR luminosity, beginning at an age
of ~ 1 Gyr. They are the chief reason for the difference between Geneva
and Padova after that epoch.
The main trends in Fig. 6 are (i) a gradual shift of the peak wavelength from the blue to the red due to the disappearance of massive stars and the appearance of red giants; (ii) more pronounced line-blanketing and associated flux depression in the blue than in the red; (iii) stronger variations over time in the blue than in the IR. Next, I will turn to colors in order to quantify these effects and to provide direct comparisons with observations.
In Fig. 7, I illustrate the influence of
different stellar evolution models on the predicted photometric
evolution for solar metallicity. Shown are models computed
using the Padova 1994
([8],
[9]),
the Geneva
([41]),
and the Padova 2000
([11])
tracks. (B - V) and M / LV are quite similar
with the three sets of tracks, whereas (V - K) shows
rather significant differences. This reflects the good agreement of the
model predictions for stars relatively close to the main-sequence, which
influence the optical colors, and the larger uncertainty of the giant
and RSG colors in the near-IR. The largest differences arise at early
ages (< 10 Myr) because of the larger number of evolved W-R stars in
the Padova models than in the Geneva models. Another notable difference
exists between ages of 10 and 20 Myr when RSGs dominate in the
near-IR. AGB stars become important between 108 and
109 yr, and the differences in the color evolution reflect
uncertainties of the AGB evolution. Furthermore, since the minimum
mass for quiet helium ignition is lower in the Geneva than in the Padova
1994 models
(1.9 M versus
2.2 M), the
helium flash occurs at slightly later ages in the Geneva
models (see the bump around 1 Gyr in
Fig. 7). At late ages, the (V - K) color is
significantly bluer in the Padova 2000 model than in the Padova 1994
model. The reason is the 50 - 200 K higher Teff of the
red giant branch in the 2000 versus the 1994 tracks.
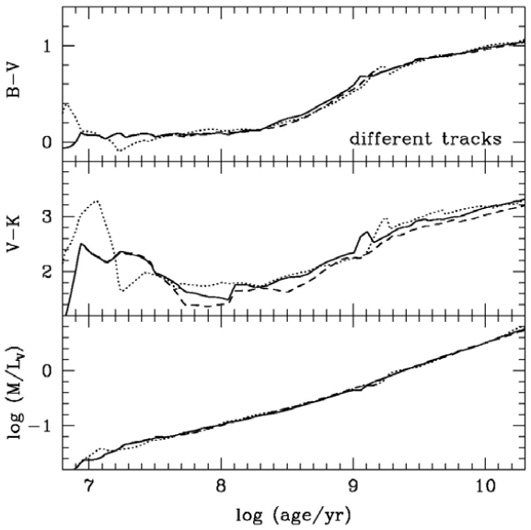 |
Figure 7. Evolution of the (B - V) and (V - K) colors and the stellar mass-to-light ratio M / LV of simple stellar populations of solar metallicity computed using the Geneva (dotted line), Padova 1994 (solid line), and Padova 2000 (dashed line) stellar evolution prescriptions ([2]). |
Colors are subject to multiple degeneracies caused, among others, by metallicity, age, or reddening. If permitted by the observations, one would always want to compare data and models at the highest possible resolution. In Fig. 8, I am showing the spectral evolution of a single stellar population with the same parameters and using the same technique as in Fig. 6. The spectra were calculated from model atmospheres. The difference between the SEDs in the two figures is the 100 times higher spectral resolution in Fig. 8 (0.2 Å). This resolution permits diagnostics beyond those based on colors. For instance, Fig. 8 highlights the evolution of the Balmer series limit until its disappearance around ~ 1 Gyr, followed by the formation of the 4000 Å break. Such diagnostics can be successfully traded to break the previously mentioned degeneracies.
 |
Figure 8. Theoretical spectral evolution of a single stellar population with solar composition predicted by the Geneva (left) and the Padova 2000 (right) models. Ages from top to bottom are 4 Myr, 10 Myr, 50 Myr, 200 Myr, 1 Gyr, 3 Gyr, and 10 Gyr ([12]). |
An alternative approach is to incorporate empirical spectral libraries into a synthesis code and perform suitable interpolations in parameter space for complete HRD coverage. This is the method used by PEGASE-HR, a new stellar population synthesis program generating high-resolution spectra at R = 10,000 in the optical range between 4000 and 6800 Å ([27]). The program links the spectrophotometric model of galaxy evolution PEGASE.2 ([10]) to an updated version of the ELODIE library of stellar spectra. An example is reproduced in Fig. 9. [27] used these new high-resolution spectra to calculate sets of line indices for age- and metallicity determinations. Some of them are based on the classical Lick indices ([52]). The high spectral resolution opens up a new dimension in parameter space: R is large enough to address kinematic effects. Kinematic studies require the model resolution to be significantly higher than the resolution of the data as imposed by the galaxy velocity dispersion. With R = 10,000, even low-luminosity dwarf galaxies or even very luminous stellar clusters become accessible to modeling.
 |
Figure 9. Evolution of the principal
stellar lines as a function of age for ages of 1, 4, 13 Gyr (from
light gray to black, respectively) at
Z |