

The correlations between halo rc,
 0,
and
  and galaxy
absolute magnitude MB are illustrated in
Figures 2 -
4. Figure 2 shows
results derived using isothermal halos.
Figure 3 shows results derived using
pseudo-isothermal halos. Figure 4 combines all
of the data, as discussed below.
 |
Figure 2. Dark matter parameter
correlations derived using isothermal halos in rotation curve
decompositions of Sc - Im galaxies (circles). Central dark
matter densities of dSph galaxies (filled triangles) and dI
galaxies (upside-down filled triangles) are derived via
King (1966)
model fits; corresponding rc and
|
The main result of this paper is that DM satisfies well defined scaling laws. Halos in less luminous galaxies have smaller core radii, higher central densities, and smaller central velocity dispersions.
The scatter about the correlations is slightly smaller in Figure 2 than in Figure 3. It is not surprising that decompositions based on the isothermal sphere are better behaved, given the slow rise of the PITS rotation curve to its asymptotic value (Fig. 1). However, rotation curve decompositions based on isothermal and PITS models separately give essentially the same correlations.
 |
Figure 3. Dark matter parameter correlations derived using the pseudo-isothermal sphere to model DM halos in rotation curve decompositions of Sc - Im galaxies (filled squares). The straight lines are least-squares fits to all the points. Parameter sources: Broeils (1992); Corbelli (2003); de Blok & McGaugh (1996, 1997); de Blok, McGaugh, & Rubin (2001); Meurer et al. (1996); Meurer, Staveley-Smith, & Killeen (1998); Miller & Rubin (1995); Skillman et al. (1987); Swaters, Madore, & Trewhella (2000); Swaters et al. (2003); van Zee et al. (1997); Verheijen (1997); Weldrake, de Blok, & Walter (2003). |
There are 31 galaxies with isothermal DM decompositions and 37 with PITS decompositions. Only 13 galaxies are common to both samples. So the results in Figures 2 and 3 are largely independent. Clearly, we want to combine the two samples. We do this by scaling the correlations in Figure 3 to those in Figure 2.
Least-squares fits to the correlations in Figure 2 (omitting NGC 4605) give:
 |
Least-squares fits to the correlations in Figure 3 give:
 |
The two samples have essentially the same average absolute magnitude: < MB > = - 18.12 for objects analyzed with isothermals and < MB > = - 17.83 for those analyzed with pseudo-isothermals. The average of the above values is MB = - 17.97. Requiring that the correlations agree at MB = - 18 provides the scaling of the PITS results to those measured with the isothermal sphere (ITS):
 |
Here we explicitly identify the parameters derived with the different DM models. This scaling is intermediate between the middle and right panels of Figure 1.
 |
Figure 4. Dark matter parameter
correlations for Sc-Im,
dwarf spheroidal (dSph), and dI galaxies. The symbols are the same as in
Figures 2 and 3. For
dSph and dI galaxies,
|
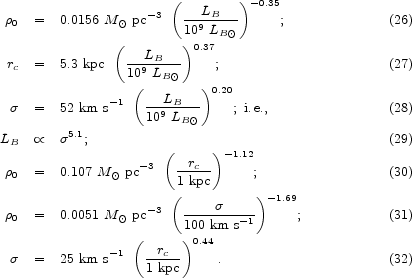
Figure 4 shows the combined sample after scaling of the pseudo-isothermal results to those determined with isothermal halos. Based on 55 galaxies spanning 9 magnitudes in MB, the correlations are quite robust. Uncertainties in rotation curve decomposition are unlikely to threaten them, although the slopes are still uncertain. If we keep only the galaxies with the most leverage on the DM, say the 11 galaxies whose rotation curves reach out to at least 10 times the scale length of the disk (one of these is NGC 3198, in which the ratio is 11.4), then we get essentially the same correlations with essentially the same scatter. Least-squares fits to the points in Figure 4 give:
 |
In physically more transparent terms (109
LB  is
MB = - 17.03),
 |
Equations 26 and 27 imply that halo surface density, which is
proportional to
 0
rc, is nearly independent of galaxy luminosity.
This near-independence is illustrated explicitly in
Figure 5. It implies a
Tully-Fisher (1977)
relation similar to equation 29 (cf.
Fall 2002).
Since mass
M
 0
rc3 and since
 0
rc
0
rc  constant, M1/2
 rc. Then
M
 2
rc implies that
M
 4. We find that
LB
 5.1. This
suggests that M / LB
 LB-0.22. If we correct for the slight
dependence of halo surface density on LB
(Fig. 5), then this becomes
M / LB
 LB-0.24. Slope uncertainties
are significant, so we should be cautious in how much we interpret
this result. However, it is a plausible estimate of the degree to which
small galaxies are more DM dominated than large ones. UGC 2885
(MB = - 22.3) is brighter than UMi
(MB = - 7.6) by 14.7 mag. Over 15 mag,
M / LB
 LB-0.24 implies that M /
LB changes by a factor of 26. This is entirely
reasonable.
 |
Figure 5. Logarithm of
|