


The current generation of large and uniform redshift surveys (e.g., CfA-RS, 2dF, SDSS, 6dFGS) provide a means to construct the 3-D space density of galaxies for volumes vastly exceeding those of the pioneering works from the 1980's. In the coming years new "radial velocity machines," such as Echnida (Moore, Gillingham & Saunders 2002), have the potential to increase redshifts catalogs by an order of magnitude. Nonetheless, imaging surveys, including 2MASS, SWIRE, GOODS, and in the coming years, WISE (Eisenhardt & Wright 2003) catalog far more sources than the redshift surveys can ever handle. Velocity measurements will always be in the position of catching up with broad-band imaging. The interim solution to this phase-lag is to derive a "photometric redshift" using broad-band photometry measurements. Depending on the number (and spectral location) of bands used to construct the spectral energy distribution of the target galaxy, the redshift accuracy of this method ranges from 10-20% for most normal galaxies.
Photometric Redshifts - The 3-band near-infrared photometry of 2MASS is used to estimate distances to galaxies. Although this technique is very crude in terms of accuracy, it does provide a means to generate qualitative maps of the spatial distribution of galaxies and thereby construct an all sky "big picture" view of the local Universe. Here we adopt the technique devised by Jarrett et al (1998) and Kochanek et al (2003). The fundamental assumptions of this method are that galaxies have roughly (1) the same luminosity and (2) their near-infrared colors are modified by cosmic reddening (Figure 7). This method is particularly adept at revealing galaxy clusters since the redshift uncertainty declines with the sqrt of the number of cluster members detected by 2MASS. The photometric redshift of galaxy clusters is typically accurate to ~ 20% using only 2MASS photometry.
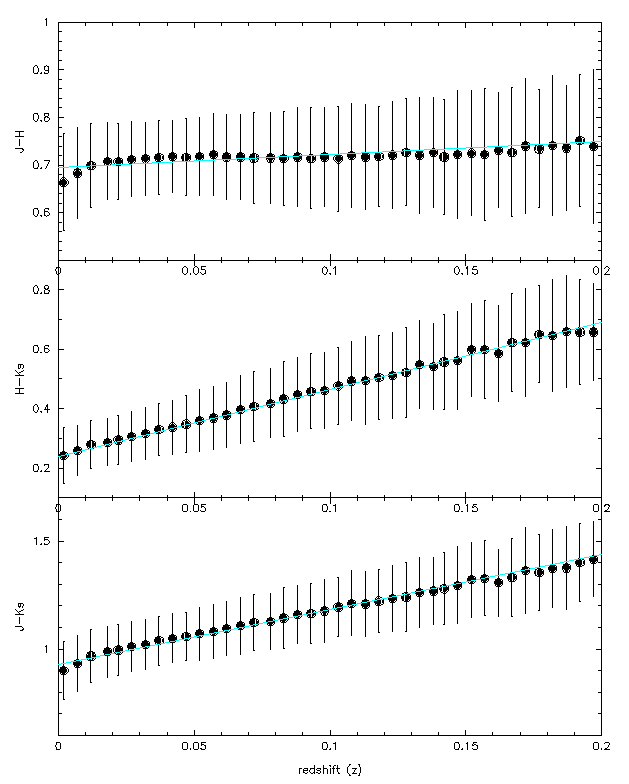 |
Figure 7. Galaxy near-infrared colors as a function of redshift. Cosmic reddening is the result of shifting of galaxy light from the H-band (1.6 µm) into the Ks-band (2.2 µm). |
By assuming that galaxies are standard candles, the distance or redshift is derived from the integrated flux, distance modulus and luminosity distance. Here we correct for Galactic extinction and incorporate the cosmic reddening "k-correction" (Figure 7) into the distance calculation for self-consistency between the measured colors and the inferred luminosity distance.
Independent studies of the K-band luminosity function (Cole et al 2001; Kochanek et al 2001) reveal consistent Schecter Function parameters: M* = -24.0 mag with a faint end slope index of about -1.0 (assuming H0 = 72 km/s/Mpc). We adopt M* as the standard candle for 2MASS galaxies. For the faintest 2MASS galaxies, K = 14 mag, the implied distance is 400 Mpc or z ~ 0.1. The actual distribution of Ks-band luminosity for all 2MASS galaxies with known redshifts is shown in Figure 8. The histogram peaks at -24.4 mag or so, implying that 2MASS is sensitive to intrinsically luminous (early-type) galaxies. (Cautionary note: the 2MASS-NED redshift sample comes from a variety of surveys, each with their own biased selection effects - a prime motivation to carry out uniform and minimally-biased redshift survey, such as that of 6dFGS). Approximately 105 2MASS galaxies have radial velocity measurements, representing a small fraction (~ 8%) of the total, but a significant fraction for the largest (nearby) galaxies.
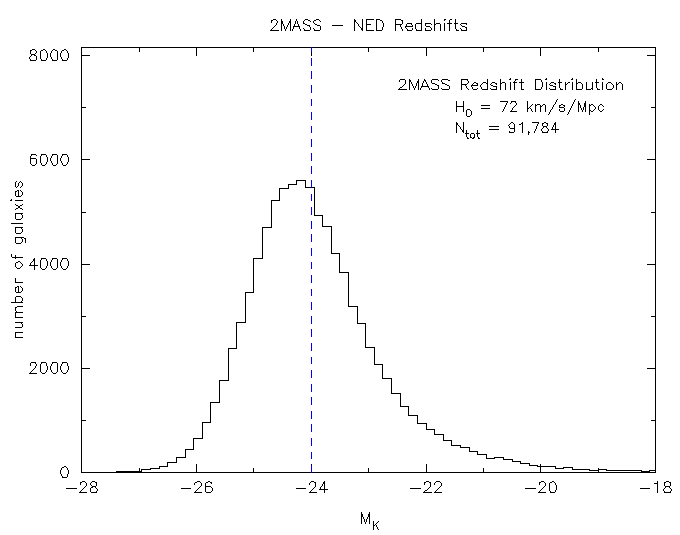 |
Figure 8. Luminosity distribution of 92,000 2MASS galaxies as computed from redshift-derived distances. The redshifts were extracted from NED, the bulk of which come from the RC3, UGC, CfA, LCRS, 2dF, 6dFGS and SDSS surveys. |
Results - A comparison of the photometric-derived redshifts with radial-velocity redshifts is shown in Figure 9, where we plot the redshift as a function of the Ks-band flux. The photometric redshift accurately predict the mean radial-velocity redshift per mag interval from the brightest (nearby) to the faintest (distant) galaxies. However, note the large scatter in the redshift distribution per mag interval - this is due to galaxies with intrinsically different luminosity (from the brightest ellipticals to the faintest dwarf galaxies). What this means is that 2MASS photometric redshifts provide the correct answer on average, but for any given galaxy the uncertainty is large, which is particularly severe for the faint end of the distribution. For galaxy groups or clusters the ensemble average redshift should be accurate to ~ 20%.
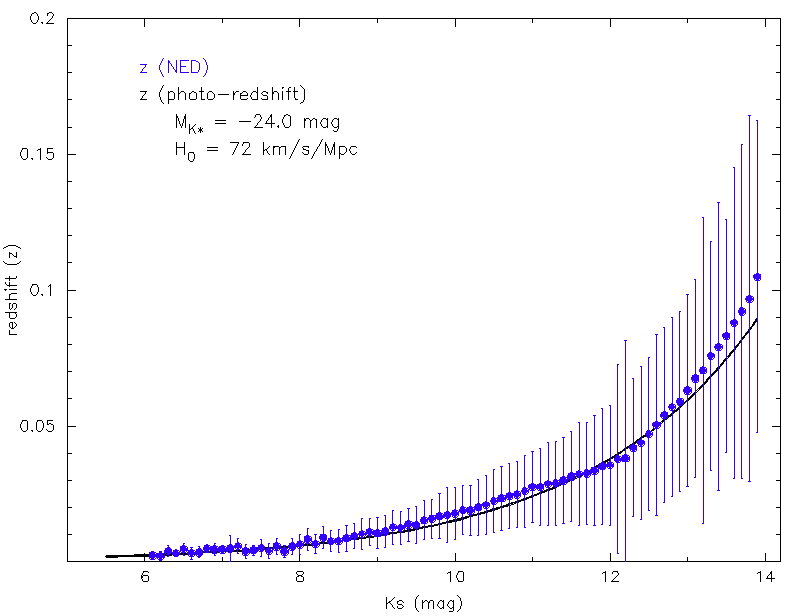 |
Figure 9. Redshift vs. 2MASS Ks-band integrated flux. Photometric redshifts (black curve) are derived assuming L* properties for 2MASS galaxies. These are compared to the radial-velocity redshifts (blue points). The error bars represent the scatter in redshift vs. Ks-band integrated flux (i.e., ranging from luminous to sub-luminous galaxies). |
All in all, photometric redshifts should provide an adequate, if qualitative, representation of the local Universe. Combining the 105 radial-velocity redshifts with the 106 photometric redshifts, a 3-dimensional construct of the distribution of galaxies comprising the local Universe is created. Figure 1 represents a view into this 3-D construct. Here the 2MASS galaxies are projected onto a Galactic coordinate (equal-area) aitoff grid with 3 arcmin pixels. Distance is denoted with color coding, where blue represents the nearest galaxies (z < 0.01), green at moderate distances (z ~ 0.03) and red the most distant objects (z &#gt; 0.06). To enhance the contrast between the nearest clusters (e.g., Virgo) and the distant universe, the pixel intensity is modified by the integrated flux along the line of sight (analogous to Figure 5). The effect is to brighten the colors of nearby galaxy clusters (e.g., the Virgo cluster appears blue-white in the figure). Finally, the 2MASS point source catalog, representing the Milky Way, is incorporated into the projection. Near the galactic center region (center of image), the confusion noise completely swamps out detection of background extragalactic objects (see Figure 1).
The Cosmic Web - Figure 1 beautifully unveils the background extragalactic sky from the obscuring foreground Milky Way. Galaxies are color-coded by their inferred redshift (or distance from the Sun), thereby providing depth to the surface distribution of galaxies. Large-scale structures are clearly discerned, from the Local Supercluster (Virgo/Hydra/Centaurus) to the Perseus-Pisces (P-P) and Pavo-Indus (P-I) superclusters. (Figure 2, a key to the large scale structures). Probing orthogonal to this 3-D surface reveals the redshift distibution along the line of sight; an example is shown in Figure 10 for the Shapley Concentration (discussed below).
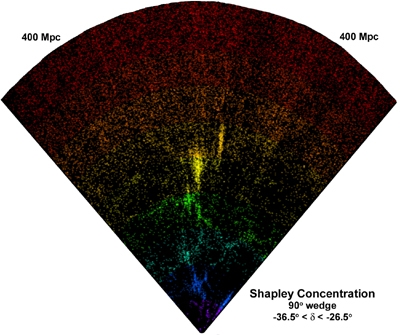 |
Figure 10. Redshift slice of the Shapley Concentration region, extending to the limit of the 2MASS galaxy catalog, z ~ 0.1 (400 Mpc). The equatorial RA slice is 90 deg between a declination boundary of -36.5° < Dec < -26.5°. The points are color-coded by redshift (see Figure 1). The "finger of god" radial velocity artifacts trace galaxy clusters, including Abell 3558 (center, yellow). The Hydra-Cen supercluster is foreground (blue fingers) to the Shapley Concentration. |
As seen in Figure 1, a continuous chain of structures seems to wrap around Hydra/Virgo, up to Coma to the north, through Hercules to the east, down through P-P and around to P-I to the west, then extending up through the ZoA into the Shapley concentration. This is more easily seen when each redshift layer is shown separately; Figure 11.
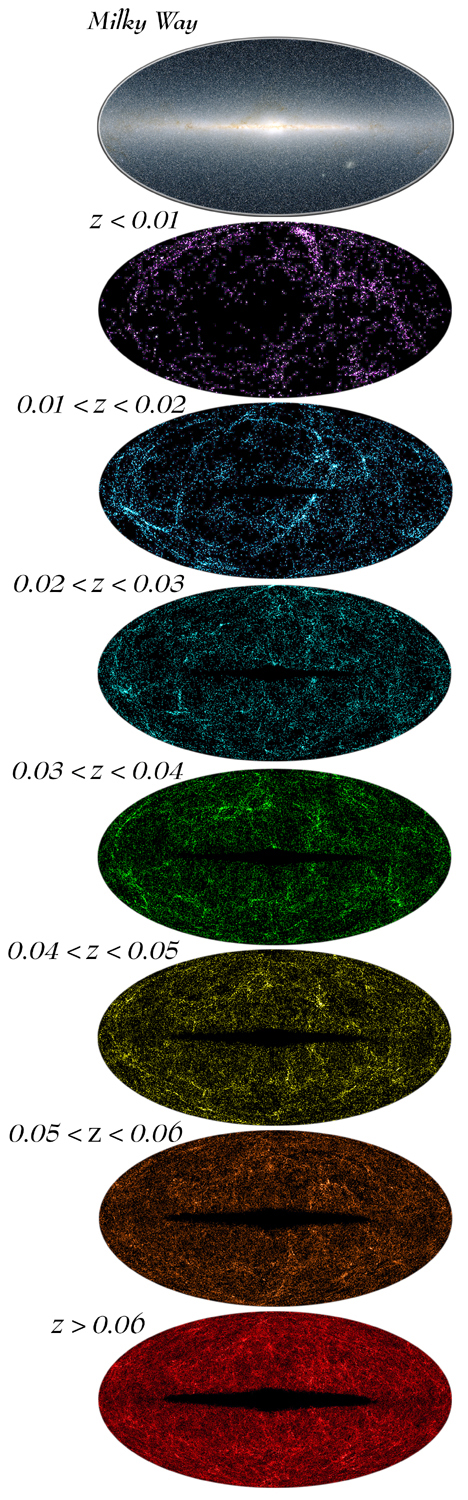 |
Figure 11. 2MASS galaxy distribution separated by redshift layer. The color scheme, when combined, creates the panorama shown in Figure 1. |
The Milky Way and Magellanic Clouds occupy the first (z = 0) redshift layer. The second layer (z < 0.01) is dominated by the Virgo, Fornax and Hydra-Cen superclusters. The third layer (0.01 < z < 0.02) is dominated by the P-P supercluster (left side of image) and the P-I supercluster extending up into the ZoA terminating as the Great Attractor region (notably Abell 3627) disappears behind a wall of Milky Way stars. An intriguing "ring" or chain of galaxies seems to circle/extend from the northern to the southern Galactic hemisphere (see also Figure 1). It is unknown whether this ring-like structure is real or a projection effect. The fourth layer (0.02 < z < 0.03) is characterized by compact galaxy clusters, including Coma (extreme top of image), Abell 3627 in the ZoA, the Ophiuchus cluster directly to the north of the Milky Way center, and clusters associated with P-P. The "great wall" of galaxies extends from Coma down toward Bootes and Hercules. The fifth layer (0.03 < z < 0.04) is dominated by the Hercules supercluster (top, left of image), the "great wall," Columba supercluster (bottom right of image), and the massive Shapley Concentration is beginning to appear. The sixth layer (0.04 < z < 0.05) showcases Abell 3558 of the enormous Shapley Concentration that lurks behind the nearby Hydra-Cen supercluster, and the Sculpter supercluster (bottom of image) makes its first appearance. The seventh layer (0.05 < z < 0.06) contains the backside of the Shapley Concentration, while the Sculpter supercluster dominates the southern hemisphere. The eighth and final layer (z > 0.06) contains the most distant structures that 2MASS resolves, including the Pisces-Cetus (located behind P-P), Bootes (located behind Hercules), Horologium and Corona Borealis galaxy clusters. At these faint flux levels, the photometric redshifts are losing their ability to discern the cosmic web beyond 300 Mpc, smearing and degrading the resolution of the 3-D construct.
This is clearly demonstrated in Figure 10, where we show the redshift distribution for the Shapley Concentration region in a constant declination slice across the equatorial axis. The nearby galaxy clusters (Hydra-Cen) are easily discerned (note the "fingers of god"), as are the rich galaxy clusters of Shapley (center of image), but beyond z > 0.06 the distribution is smoothing out as the uncertainties in the photometric redshifts begin to dominate. But the intricate web of large scale structure extends well beyond this volume limit, as unmistakably demonstrated by the 2dF and SDSS galaxy surveys. But with the addition of optical and or mid-infrared photometry from future all sky surveys (e.g., WISE), the photometric redshifts may be greatly improved, allowing reconstruction of the local Universe beyond 300 to 400 Mpc. Moreover, large redshift surveys (e.g., 6dFGS) will provide accurate distance estimates for large regions of the sky, further sharpening our view of the cosmic web.