


7.7. What are the oldest fossils we have from the early universe?
It is sometimes said that the CMB gives us a glimpse of the Universe when it was ~ 300, 000 years old. This is true but it also gives us a glimpse of the Universe when it was less than a trillionth of a second old. The acoustic peaks in the power spectrum (the spots of size less than about 1 degree) come from sound waves in the photon-baryon plasma at ~ 300, 000 years after the big bang but there is much structure in the CMB on angular scales greater than 1 degree. When we look at this structure we are looking at the Universe when it was less than a trillionth of a second old. The large scale structure on angular scales greater than ~ 1 degree is the oldest fossil we have and dates back to the time of inflation. In the standard big bang model, structure on these acausal scales can only be explained with initial conditions.
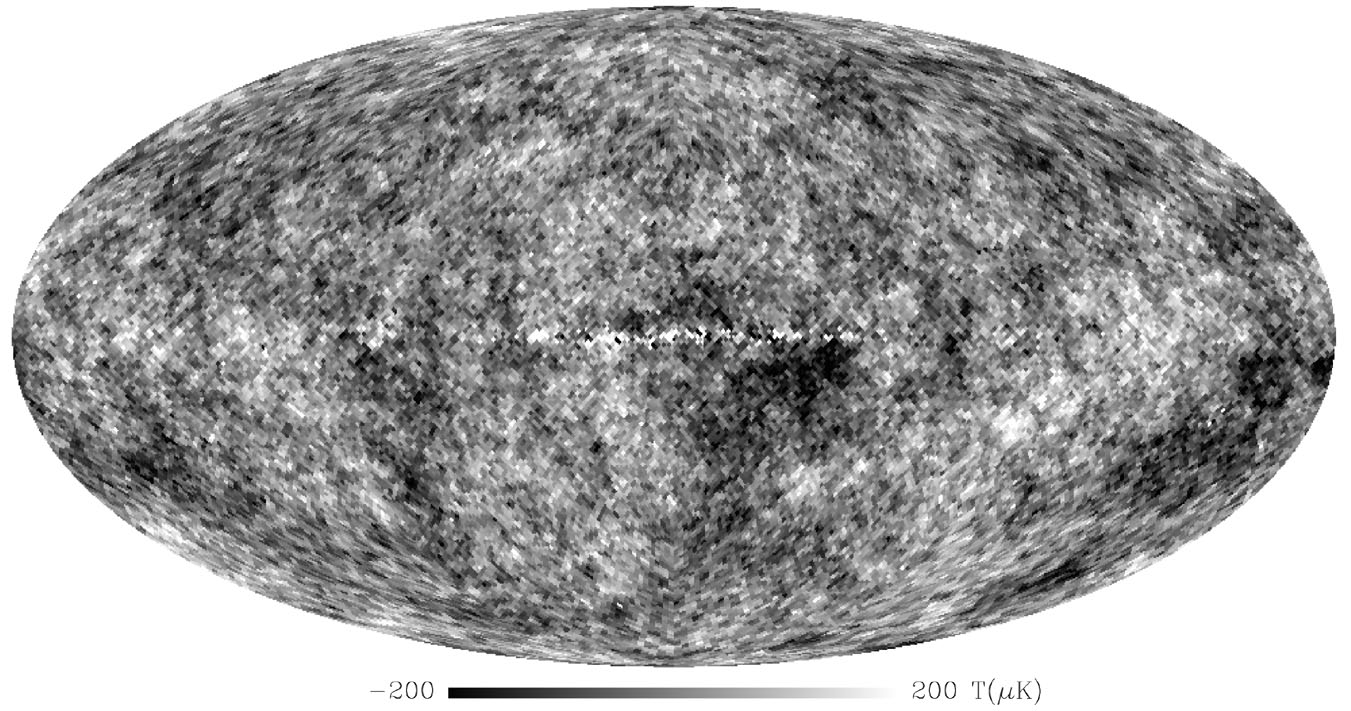
The large scale features in the CMB, i.e., all the features in the top map of Fig. 13 but none of the features in the lower map, are the largest and most distant objects every seen. And yet they are probably also the smallest for they are quantum fluctuations zoomed in on by the microscope called inflation and hung up in the sky. So this map belongs in two different sections of the Guinness book of world records.
 |
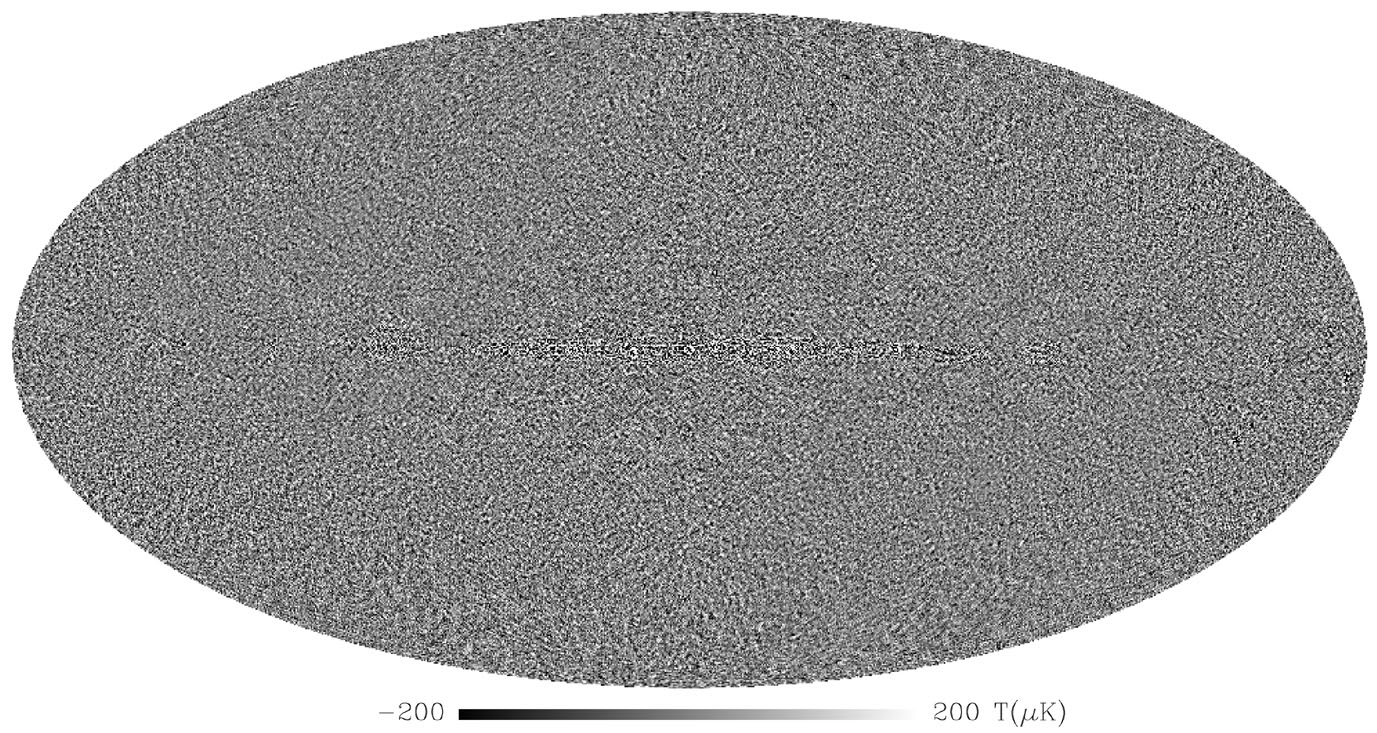 |
Figure 13. Two basic ingredients: old
quantum fluctuations (top) and new sound (bottom).
These two maps were constructed from
Fig. 12.
The top map is a smoothed version of
Fig. 12
and shows only power at angular scales greater than ~ 1 deg
( |
The small scale structure on angular scales less than ~ 1 degree (lower map) results from oscillations in the photon-baryon fluid between the redshift of equality and recombination. Figure 11 describes these oscillations in more detail.
 |
Figure 14. Size and Destiny of the
Universe. This plot shows the size of the Universe, in units of its
current size, as a function of time. The age of the five models can be
read from the x axis as the time between `NOW'
and the intersection of the model with the x axis. Models containing
|

 100, see Fig. 10).
This footprint of the inflationary epoch was made in the first
picosecond after the big bang. In the standard big bang without
inflation, all the structure here has to be attributed to initial
conditions.
The lower map was made by subtracting the top map from Fig. 12.
That is, all the large scale power was subtracted from the CMB leaving
only the small scale power in the acoustic peaks
(
100, see Fig. 10).
This footprint of the inflationary epoch was made in the first
picosecond after the big bang. In the standard big bang without
inflation, all the structure here has to be attributed to initial
conditions.
The lower map was made by subtracting the top map from Fig. 12.
That is, all the large scale power was subtracted from the CMB leaving
only the small scale power in the acoustic peaks
(
 curve upward (
 >
0) and are currently accelerating. The empty universe has
>
0) and are currently accelerating. The empty universe has
 (0.27, 0.73) model
is favored by the data. Over the past few billion years and on into the
future, the rate of expansion of this model increases. This
acceleration means that we are in a period of slow inflation - a new
period of inflation is starting to grab the Universe. Knowing the
values of h,
(0.27, 0.73) model
is favored by the data. Over the past few billion years and on into the
future, the rate of expansion of this model increases. This
acceleration means that we are in a period of slow inflation - a new
period of inflation is starting to grab the Universe. Knowing the
values of h,