


The morphological type of M33 has been classified on all the existing
systems: Sc (37),
Sc+ (38),
Sc II-III (39),
SA(s)cd (40),
fS3
or fS4
(41a,
b),
and L;  cd, Ha
(42). Taken
together, these indicate that M33 is a
late-type right-hand ordinary (non-barred) spiral galaxy, with an
apparent axial ratio of roughly 2: 1, with an indefinite number of long,
moderately broad, patchy spiral arms that can be traced directly into
the nuclear region (which has an F-type spectrum), and with a smooth
underlying haze or halo. Vorontsov-Velyaminov
(43) noted that the
spiral arms could be traced to within 20" (75 pc) of the nucleus.
cd, Ha
(42). Taken
together, these indicate that M33 is a
late-type right-hand ordinary (non-barred) spiral galaxy, with an
apparent axial ratio of roughly 2: 1, with an indefinite number of long,
moderately broad, patchy spiral arms that can be traced directly into
the nuclear region (which has an F-type spectrum), and with a smooth
underlying haze or halo. Vorontsov-Velyaminov
(43) noted that the
spiral arms could be traced to within 20" (75 pc) of the nucleus.
Whitford (44) measured M33 photoelectrically through a 54' circular diaphragm, and obtained mpg = 6.9 after correction for foreground stars and conversion to the international scale. Stebbins and Whitford (45a, b, c) included M33 in their six-colour photoelectric photometry of galaxies. In all three studies they used diaphragms of fixed sizes, centred on the nucleus; none of the diaphragms was large enough to include more than a small central portion of M33. As expected from the composite nature of the spectrum, the colour indices showed both violet and red colour excesses when compared with the colours of an individual star. Tifft's (46) four-colour photometry and McClure's and van den Bergh's (47) five-colour photometry also included only the nuclear region of M33. Although one of the primary objectives of multicolour photometry of galaxies is to provide information on the relative numbers of different types of stars contributing to the light of the galaxies, no photometric model of the stellar population of M33 has yet appeared in the literature.
A different type of photometric study is surface photometry in one or a few colours to determine the orientation of a galaxy and the distribution of light within it. Seyfert (48) found that, in spite of the very patchy appearance of M33 in photographs, most of the light followed a very smooth distribution. The spiral arms were barely visible on NS and EW tracings of photographs in red and blue light. The arms were somewhat bluer than the nucleus. Patterson (49) discovered that the gradient of photographic luminosity followed an exponential law - photographic magnitude a linear function of radius - except within 6' of the nucleus. From microphotometer tracings every 30° of position angle, she found a position angle of the major axis of 20°, an inclination of the galactic plane to the plane of the sky of 60°, and an integrated mpg of 6.0 out to 30'. Because Danver (50) worked only with the bright, inner arms of the galaxy, his results for position angle and inclination disagreed with those of Patterson and of more recent studies. However, he also noted the difference in pitch angle of the two main spiral arms, cf. (19), and he found that isophotes crossed the north-preceding half of the minor axis farther away from the galactic nucleus than they crossed the south-following half. Currently, the definitive photometric studies of M33 are the photographic photometry by Holmberg (38), (51a, b) on the international system and the photoelectric photometry by de Vaucouleurs (52) on the UBV system. De Vaucouleurs found a position angle of 23°, an inclination of 55° and a total mB of 6.27.
Vashakidze (53) measured 13 per cent mean optical polarization for M33, which was in line with the trend he found of percentage polarization increasing with advancing morphological type in a sample of 11 galaxies.
The existence of emission nebulae within M33 has been known at
least since Pease (24)
obtained a spectrogram of NGC 604. Detection
of these emission regions has been accomplished primarily by
comparison of blue plates (sensitive to [O II] 3727 Å) and/or red
plates
(sensitive to H ) to
yellow plates and/or infra-red plates. Catalogues
of emission regions have been compiled by
Haro (54),
Aller (55a,
b),
Shajn (56),
and Sérsic (57).
By means of narrow
H interference filters
Courtés and Cruvellier
(58a,
b)
found many emission regions in the central portion of M33, which is burned out on plates obtained by
more classical methods. Within the errors of measurement, the H II
regions in M33 have the same chemical composition as those in our
own Galaxy (59a,
b),
and the Magellanic Clouds
(60).
Most of the emission nebulae are of low excitation
(61),
but some higher-excitation
regions are found farther from the nucleus
(62).
The linear diameters
of the largest H II regions are quite similar to those in the LMC.
They have been used as calibrators for a method of distance determination
to the more distant galaxies
(63a,
b) -
(65).
The masses of the
largest H II regions have been calculated by Shajn and Haze
(66a,
b).
Their measurements yield, after conversion to the presently accepted
distance scale, a mass of the order of 3 × 10⁶
M
) to
yellow plates and/or infra-red plates. Catalogues
of emission regions have been compiled by
Haro (54),
Aller (55a,
b),
Shajn (56),
and Sérsic (57).
By means of narrow
H interference filters
Courtés and Cruvellier
(58a,
b)
found many emission regions in the central portion of M33, which is burned out on plates obtained by
more classical methods. Within the errors of measurement, the H II
regions in M33 have the same chemical composition as those in our
own Galaxy (59a,
b),
and the Magellanic Clouds
(60).
Most of the emission nebulae are of low excitation
(61),
but some higher-excitation
regions are found farther from the nucleus
(62).
The linear diameters
of the largest H II regions are quite similar to those in the LMC.
They have been used as calibrators for a method of distance determination
to the more distant galaxies
(63a,
b) -
(65).
The masses of the
largest H II regions have been calculated by Shajn and Haze
(66a,
b).
Their measurements yield, after conversion to the presently accepted
distance scale, a mass of the order of 3 × 10⁶
M for
NGC 604, the largest H II region in M33. (All distance-dependent quantities have
been recalculated for consistency with a distance of 720 kpc
(64).)
for
NGC 604, the largest H II region in M33. (All distance-dependent quantities have
been recalculated for consistency with a distance of 720 kpc
(64).)
In addition to the emission lines in the H II regions, a diffuse
background of line emission has been found at 3727 A
(67) and at
H and
[N II] 6548, 6584 Å
(68).
The ratio of the [N II] lines to
H
indicates higher excitation for this diffuse component than for the
classical H II regions.
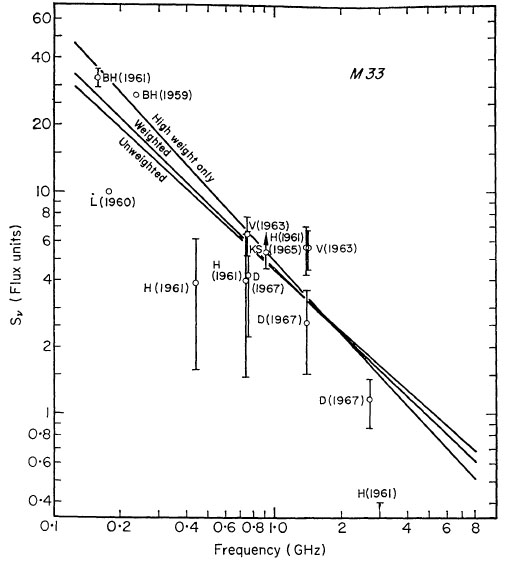
Radio-continuum radiation from M33 has been observed at
frequencies between 159 MHz and 3 GHz
(69a -
i).
Fig. 1 is a graph
of the published values of the integrated flux density from M33 as a
function of frequency. The integrated flux densities can be represented
approximately by a power-law spectrum,
S =
S0( /
0). The lines in
the figure represent least-squares solutions for the power law:
S0
(0 = 1 GHz)
=
S0( /
0). The lines in
the figure represent least-squares solutions for the power law:
S0
(0 = 1 GHz)
 5 flux units
(5)
and
-1.0. The 4C
catalogue (70)
contains no source within 45' of the position of the galaxy, indicating
that at 178 MHz the emission is smoothly distributed over a region
significantly larger than 1' in extent. At centimetre
wavelengths, the radiating region is ~ 0.5° in diameter.
5 flux units
(5)
and
-1.0. The 4C
catalogue (70)
contains no source within 45' of the position of the galaxy, indicating
that at 178 MHz the emission is smoothly distributed over a region
significantly larger than 1' in extent. At centimetre
wavelengths, the radiating region is ~ 0.5° in diameter.
|
Figure 1. The radio-continuum spectrum. The
points are published integrated flux densities of M33, with mean errors indicated where known. The points
are labelled with authors' initials and dates of publication
(69a -
i).
The lines
represent three different linear-least-squares regression curves of log
S |
The neutral-hydrogen distribution was found to extend 'far beyond the structure visible on the available photographs' (71) even in the earliest 21-cm line observations of M33. However, an attempt to find an H I link between M33 and its nearest neighbour, M31, was unsuccessful (72). The angular resolution of the early data was insufficient to provide any details of the hydrogen distribution. But, more recently, Davies (73) and Burke (73) noted that their observations with the 250-foot and 300-foot telescopes, respectively, indicated a ring-shaped distribution of the neutral hydrogen in M33. The radius of this ring has been placed between 15' and 20' (73), (74a, b), (75). However, the centre of the ring is displaced by a few minutes of arc from the optical centre of the galaxy (76), and there are other departures from axial symmetry. The most striking of these are a pair of 'wings' on the north-preceding and south-following ends of the galaxy, nearly 1° from the galactic centre (75).
Because there is a difference of several magnitudes between the photographic luminosities of the brightest stars of Populations I and II, the first stars to be resolved in external galaxies are Population I objects. The first individual stars recognized in M33 were Duncan's (33) three variables and a nova. Hubble (34), (35) - who at the time was interested primarily in determining the distance to M33 - discussed this nova, Cepheids, and a luminosity function derived from star counts of selected fields within M33. Hubble and Sandage (77) found that the brightest variable stars (intermediate-type supergiants) formed a group with a small dispersion in luminosity, thus providing another distance criterion for galaxies. By comparing a colour-magnitude diagram of stars in M33 to a composite colour-magnitude diagram of young galactic clusters (Population I objects in our own Galaxy), Johnson and Sandage (78) rederived the distance to M33.
De Vaucouleurs (79)
extended the star counts to cover the entire face of M33 down to 20th photographic magnitude
(mB
 20.2 or MB
-4.4). On the basis of
these counts, he found
(80) the centre
of the distribution of the brightest Population I stars to be displaced
to the southwest of the optical centre. Vorontsov-Velyaminov
(43),
(81a,
b)
found that the supergiants in M33 tended to crowd together
and form compact groups, 65 of which he catalogued. He stated that
the dust in the spiral arms appeared to avoid close contact with such
groups.
20.2 or MB
-4.4). On the basis of
these counts, he found
(80) the centre
of the distribution of the brightest Population I stars to be displaced
to the southwest of the optical centre. Vorontsov-Velyaminov
(43),
(81a,
b)
found that the supergiants in M33 tended to crowd together
and form compact groups, 65 of which he catalogued. He stated that
the dust in the spiral arms appeared to avoid close contact with such
groups.
The first mention of the possible presence of Population II stars in M33 was Hubble's (82) discovery of 12-15 objects which he tentatively identified as globular clusters. He noted, however, that they were fainter and bluer than most globular clusters in M31 and our Galaxy Hiltner (83) performed UBV photometry on 23 clusters, including those found by Hubble. He suggested that they might be rich galactic clusters rather than globulars, but noted that, on the other hand, they might be counterparts of the faint blue globular cluster NGC 7492 in the Milky Way. These results were corroborated by Kron and Mayall (84), who included 4 clusters in M33 in their PV photometry. Vorontsov-Velyaminov (43) stated that the only trace of a Population II nucleus he could find for M33 was a feature no larger than a single globular cluster. Walker (85a, b) obtained an infra-red plate (103a-U + RG8) of M33, with a limiting magnitude between the apparent magnitudes of Populations II and I red giants, and a blue plate (103a-O + GG13) exposed to the same density for OB stars as the infra-red plate. Making a composite from the blue negative and an infra-red positive, Walker brought to light the existence of a smooth, elliptical distribution of Population II red giants in M33. From this evidence he argued that M33 must be just as old as M31, and that the difference in their morphological appearance was due solely to different initial conditions.
Although the rotation of M33 was discovered in 1916 (25), the first study of the rotation appeared more than two decades later (86a, b). This study by Mayall and Aller was based upon the radial velocities of 25 emission nebulae, determined from low-dispersion spectrograms. The rotation curve was roughly linear within 15 of the nucleus, reached a peak of ~ 105 km s-1 radial velocity (~ 125 km s-1 circular velocity) between 15' and 20', and decreased thereafter. Models of the mass distribution responsible for the observed rotation were discussed by various authors (87a - h) between 1941 and 1957. Because of the limited accuracy of the data, quite different models could yield satisfactory agreement. In contrast to the situation in M31 and the Milky Way, no rapidly rotating nucleus has been seen in M33 (88a, b). The observations of M33 were of limited usefulness in the discussions (89a, b, c), (90) of whether spiral arms lead or trail in galactic rotation because of the difficulty in determining which side of M33 is closer to the observer. After the controversy had been settled in 1958 (90), de Vaucouleurs' photometric study of M33 (46) showed that its arms trailed, like those of the rest of the galaxies for which the sense of rotation could be determined.
New kinematical data for M33 were added by the observations of
Dieter (91)
and Volders (92)
in the 21-cm line of neutral atomic
hydrogen. These observations yielded much better velocity resolution
than did the optical data. However, the positional accuracy of the
measurements was quite low, since the half-power beam widths of the
telescopes were respectively 53' and 34'. The masses
derived in the two radio studies (~ 2 × 10¹⁰
M) were both
significantly larger than
the masses found from the Mayall and Adler data. Burke, Turner
& Tuve (93)
obtained 21-cm observations with angular and velocity
resolution both improved over those available to Dieter and Volders,
but restricted their study to the major and minor axes of M33. They
found that the systemic velocities obtained from the observations along
the two axes disagreed by 5 km s-1, an amount which they
stated 'is
significant but is not understood'. They did not derive a mass for M33
from their observations.
Brandt (94)
used 110 Å mm-1 spectrograms to determine radial
velocities from the H
emission of 24 H II regions in M33, mostly the
same regions used by Mayall and Aller. Brandt's measurements
indicated that the turnover point of the rotation curve lay beyond the
outermost optical features within M33 (in disagreement with the earlier
optical measurements). Because his measurements did not reach the
turnover point of the rotation curve, he supplemented them with
Dieter's and Volders' radio data, finding a total mass of 3.9 ×
1010
M
for M33. Also, by truncating his model at appropriate
distances from
the centre of the galaxy, he found 'remarkably consistent' agreement
between his results and all of the previous mass determinations.
Takase and Kinoshita (95)
combined the radio data with the older
optical velocity measurements and found a significantly smaller total
mass.
The most detailed kinematical study of M33 available is by Carranza
et al. (68).
Using Fabry-Perot interferograms of the
H emission from
M33, they measured 1048 points in the galaxy at
dispersions of 15-30 Å mm-1. They found an asymmetry
between the northern and
southern halves of the rotation curve; the mean of the two agreed
with Brandt's measurements. Furthermore, in the southern half of the
galaxy they found that the gas in the spiral arm appeared to be
rotating more rapidly than the gas in the adjacent interarm region at
the same distance from the nucleus.
The extensive 21-cm study by Gordon
(75)
with a beamwidth of 10'
confirmed the location of the peak of the rotation curve outside the
optical picture of the galaxy. It also confirmed the existence of the
asymmetry of the rotation curve and found departures from circular
motion, particularly in the outer parts of M33. Gordon's value for
the total mass of the galaxy was 4.9 × 10¹⁰
M, the
increase over
Brandt's value arising primarily from extrapolating a greater fraction
of the mass in the outermost fringes of the galaxy.
5 n1 flux unit = 10-26 W m-2 Hz-1. Back.