


The techniques that allow us to detect supermassive black holes in quiescent galaxies are rarely applicable to the hosts of bright AGNs. In the Seyfert 1 galaxies and in the handful of QSOs that are close enough that the black hole's sphere of influence has some chance of being resolved, the presence of the bright non-thermal nucleus (e.g. Malkan, Gorjian & Tam 1998) severely dilutes the very features which are necessary for dynamical studies. The only bright AGN in which a supermassive black hole has been detected by spatially-resolved kinematics is the nearby (Herrnstein et al. 1999; Newman et al. 2001) Seyfert 2 galaxy NGC 4258, which is blessed with the presence of an orderly water maser disk (Watson & Wallin 1994; Greenhill et al. 1995; Miyoshi et al. 1995). The radius of influence of the black hole at its center, ~ 0 ".15, can barely be resolved by HST but can be fully sampled by the VLBA at 22.2 GHz. Unfortunately, water masers are rare and of the handful that are known, only in NGC 4258 are the maser clouds distributed in a simple geometrical configuration that exhibits clear Keplerian motion around the central source (Braatz et al. 1996; Greenhill et al. 1996, 1997; Greenhill, Moran & Herrnstein 1997; Trotter et al. 1998). Black hole demographics in AGNs must therefore proceed via alternate routes.
Dynamical modeling of the broad emission line region (BLR) constitutes
a viable alternative to spatially-resolved kinematical studies.
According to the standard model, the BLR consists of many (107 -
8,
Arav et al. 1997,
1998;
Dietrich et al. 1999),
small, dense (Ne ~ 109 - 11
cm-3), cold (Te ~ 2 × 10⁴ K)
photoionized clouds
(Ferland et al. 1992),
localized within a volume
of a few light days to several tens of light weeks in diameter around the
central ionization source (but see also
Smith & Raine 1985,
1988;
Pelletier & Pudritz
1992;
Murray et al. 1995;
Murray & Chiang 1997;
Collin-Souffrin et
al. 1988).
As such, the BLR is, and will
likely remain, spatially unresolved. In the presence of a
variable non-thermal nuclear continuum, however, the
responsivity-weighted radius RBLR of the BLR is
measured by the
light-travel time delay between emission and continuum variations
(Blandford & McKee
1982;
Peterson 1993;
Netzer & Peterson
1997;
Koratkar & Gaskell
1991).
If the BLR is gravitationally bound,
the central mass is given by the virial theorem as
Mvirial =
vBLR2RBLR / G,
where the FWHM of the emission lines (generally
H ) is taken as being
representative of the rms velocity
vBLR, once assumptions are made about the BLR
geometry. In a few
cases, independent measurements of RBLR and
vBLR have been
derived from different emission lines: it is found that the two
quantities define a "virial relation" in the sense
vBLR ~ r-1/2
(Koratkar & Gaskell
1991;
Wandel, Peterson &
Malkan 1999;
Peterson & Wandel
2000),
suggesting a simple picture of a stratified BLR in Keplerian motion.
) is taken as being
representative of the rms velocity
vBLR, once assumptions are made about the BLR
geometry. In a few
cases, independent measurements of RBLR and
vBLR have been
derived from different emission lines: it is found that the two
quantities define a "virial relation" in the sense
vBLR ~ r-1/2
(Koratkar & Gaskell
1991;
Wandel, Peterson &
Malkan 1999;
Peterson & Wandel
2000),
suggesting a simple picture of a stratified BLR in Keplerian motion.
On the downside, mapping the BLR response to continuum variations
requires many (~ 101 - 2) repeated observations taken at closely
spaced time intervals,
 t
t
 0.1RBLR/c.
Moreover, the observations can be translated into black hole
masses only if a series of reasonable, but untested,
assumptions are made regarding the geometry, stability and
velocity structure of the BLR,
the radial emissivity function of the gas, and the
geometry and location (relative to the BLR) of the ionizing continuum
source. If a wrong assumption is made, systematic errors of
a factor ~ 3 can result
(Krolik 2001).
The uncertainties surrounding reverberation mapping
has made the derived black hole masses an easy target for critics (e.g.
Richstone et al. 1998;
Ho et al. 1999).
On the other hand, because the BLR gas samples a spatial region very
near to the black hole, there is almost no possibility of making
the much larger errors in
M
0.1RBLR/c.
Moreover, the observations can be translated into black hole
masses only if a series of reasonable, but untested,
assumptions are made regarding the geometry, stability and
velocity structure of the BLR,
the radial emissivity function of the gas, and the
geometry and location (relative to the BLR) of the ionizing continuum
source. If a wrong assumption is made, systematic errors of
a factor ~ 3 can result
(Krolik 2001).
The uncertainties surrounding reverberation mapping
has made the derived black hole masses an easy target for critics (e.g.
Richstone et al. 1998;
Ho et al. 1999).
On the other hand, because the BLR gas samples a spatial region very
near to the black hole, there is almost no possibility of making
the much larger errors in
M that
have plagued the ground-based stellar kinematical studies
(Magorrian et al. 1998).
Thanks to the efforts of international collaborations,
reverberation mapping masses are now available for 17
Seyfert 1 galaxies and 19 QSOs
(Wandel, Peterson &
Malkan 1999;
Kaspi et al. 2000).
that
have plagued the ground-based stellar kinematical studies
(Magorrian et al. 1998).
Thanks to the efforts of international collaborations,
reverberation mapping masses are now available for 17
Seyfert 1 galaxies and 19 QSOs
(Wandel, Peterson &
Malkan 1999;
Kaspi et al. 2000).
Taken at face value, reverberation mapping radii are found to correlate with the non-thermal optical luminosity of the nuclear source. While the exact functional form of the dependence is debated (Koratkar & Gaskell 1991; Kaspi et al. 1996, 2000; Wandel, Peterson & Malkan 1999), the RBLR - L relation can potentially provide an inexpensive way of bypassing reverberation mapping measurements on the way to determining black hole masses.
3.1. AGN Black Hole Demographics from the
M -
Mbulge Relation
With one exception
(Ferrarese et al. 2001),
black hole demographic studies for AGNs have been based on the
M -
MB, rather than on the
M -
 , relation for the simple
reason that few accurate
measurements exist in AGN hosts (e.g.
Nelson & Whittle
1995).
Lbulge, on the other hand, is more easily measured than
(though not
necessarily more accurately measured, as discussed below).
The modest sample of AGNs with reverberation mapping black hole masses is
often augmented using masses derived from the
RBLR - L relation
(Wandel 1999;
Laor 1998,
2001;
McLure & Dunlop
2000).
For a sample of 14 PG quasars,
Laor (1998)
reported reasonable agreement with the
M -
MB relation derived by
Magorrian et al. (1998)
for quiescent galaxies, finding
<M /
Mbulge> = 0.006.
Seyfert 1 galaxies define a significantly different
correlation according to
Wandel (1999):
<M /
Mbulge> = 0.0003. Most recently,
McLure & Dunlop
(2000)
have reanalyzed the QSO sample of Laor
and the Seyfert sample of Wandel (the first augmented with almost as
many new objects and both with new spectroscopic and/or photometric data for
the existing objects). McLure & Dunlop split the difference of the two
ealier studies by obtaining
<M /
Mbulge> = 0.0025.
They find no statistical difference between Seyfert 1s and QSOs.
, relation for the simple
reason that few accurate
measurements exist in AGN hosts (e.g.
Nelson & Whittle
1995).
Lbulge, on the other hand, is more easily measured than
(though not
necessarily more accurately measured, as discussed below).
The modest sample of AGNs with reverberation mapping black hole masses is
often augmented using masses derived from the
RBLR - L relation
(Wandel 1999;
Laor 1998,
2001;
McLure & Dunlop
2000).
For a sample of 14 PG quasars,
Laor (1998)
reported reasonable agreement with the
M -
MB relation derived by
Magorrian et al. (1998)
for quiescent galaxies, finding
<M /
Mbulge> = 0.006.
Seyfert 1 galaxies define a significantly different
correlation according to
Wandel (1999):
<M /
Mbulge> = 0.0003. Most recently,
McLure & Dunlop
(2000)
have reanalyzed the QSO sample of Laor
and the Seyfert sample of Wandel (the first augmented with almost as
many new objects and both with new spectroscopic and/or photometric data for
the existing objects). McLure & Dunlop split the difference of the two
ealier studies by obtaining
<M /
Mbulge> = 0.0025.
They find no statistical difference between Seyfert 1s and QSOs.
The different conclusions reached by these authors can be traced to a number of factors.
/
Mbulge.
/
Mbulge> measured by Laor.
Here, the bolometric non-thermal nuclear
luminosity used in estimating RBLR from the
RBLR - L relation
is a factor ~ 3 larger in Laor than in McLure & Dunlop (for the
same cosmology). Everything else being equal, this leads to a factor
~ 2 increase in the black hole masses. It is unclear which
luminosities are more correct;
however it seems that the McLure & Dunlop values are
to be preferrred for the following reason. The RBLR -
L relation
is defined using monochromatic luminosity (at 5100 Å in
Kaspi et al. 2000,
and 4800 Å in
Kaspi et al. 1996).
This can be transformed
to a bolometric luminosity by assuming a power law of given spectral
index for the nuclear spectrum. McLure & Dunlop used monochromatic
luminosities applied to the
Kaspi et al. (2000)
relation, while Laor started from bolometric luminosities (from
Neugebauer et al. 1987),
applied a constant bolometric correction, and then used the
Kaspi et al. (1996)
relation. The more direct route used by McLure & Dunlop
(which bypasses the need for a bolometric correction) seems to be
preferable.
We have recomputed the data from the Wandel (1999) and McLure & Dunlop (2000) studies under a uniform set of assumptions, as follows:
 L5100 / 1044ergs
s-1)0.7 light days
(Kaspi et al. 2000).
While it is likely that the slope of
this correlation will be refined once accurate estimates of
RBLR are obtained at low and high luminosities, this
is currently the best estimate of the functional form of the
RBLR - L
relation. Because all QSOs have higher luminosities than the objects
that define the RBLR - L relation, adopting
RBLR
L5100 / 1044ergs
s-1)0.7 light days
(Kaspi et al. 2000).
While it is likely that the slope of
this correlation will be refined once accurate estimates of
RBLR are obtained at low and high luminosities, this
is currently the best estimate of the functional form of the
RBLR - L
relation. Because all QSOs have higher luminosities than the objects
that define the RBLR - L relation, adopting
RBLR  (
L5100)0.5 (e.g.
Kaspi et al. 1996)
would lead to estimates of RBLR and
M that
are 1.5 to 3 times smaller respectively.
(
L5100)0.5 (e.g.
Kaspi et al. 1996)
would lead to estimates of RBLR and
M that
are 1.5 to 3 times smaller respectively.
 3 /
2FWHM(H),
i.e. the BLR is spherical and characterized by an isotropic velocity
distribution. This differs from the assumption made by
McLure & Dunlop that the BLR is a thin, rotation-dominated disk,
i.e. v =
1.5FWHM(H),
which predicts velocities 1.7 times
larger and black holes masses three times greater.
3 /
2FWHM(H),
i.e. the BLR is spherical and characterized by an isotropic velocity
distribution. This differs from the assumption made by
McLure & Dunlop that the BLR is a thin, rotation-dominated disk,
i.e. v =
1.5FWHM(H),
which predicts velocities 1.7 times
larger and black holes masses three times greater.
L0.18
(Magorrian et al. 1998).
This is the relation defined by the local sample of quiescent galaxies,
for which
Merritt & Ferrarese
(2001a)
derived
M /
Mbulge = 0.13%. Fundamental plane studies
(Jorgensen, Franx & Kjaergaard 1996)
point to a steeper dependence:
M/L
L0.34. Accounting for the proper normalization, and
given the
range in luminosity spanned by the QSOs and Seyfert 1 galaxies, using
the latter relation would increase all inferred
M /
Mbulge ratios by a factor ~ 2.5.
|
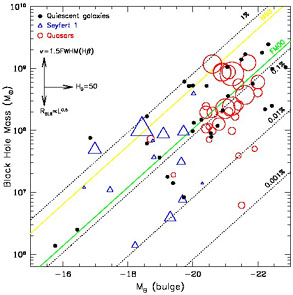
Figure 8. The
M |
The results are shown in Figure 8. We draw the following conclusions.
/
Mbulge> = 0.09% (QSOs)
and 0.12% (Seyferts), compared with
<M /
Mbulge> = 0.13% for quiescent galaxies
(Merritt & Ferrarese
2001a).
We further note that the disk/bulge decompositions for two of the
objects with low
M /
Mbulge, 0.001% - 0.001%, are deemed of lower quality
(McLure & Dunlop
2000).
Thus it does not appear to be the case, as suggested by
Richstone et al. (1998)
and Ho (1999),
that supermassive black holes in AGN are undermassive
relative to their counterparts in quiescent galaxies.
In fact, assuming a flattened BLR geometry would further increase
the AGN masses.
/
Mbulge> in AGNs is lower, by a factor
~ 6, than predicted by the
Magorrian (1998)
relation.
This is further evidence that the mass estimates derived from ground-based
kinematics were systematically in error.
line: the boundary between
regular and narrow line objects corresponds to the size used in the
figure legend. No correlation between line width and
M /
Mbulge is
readily apparent for the Seyferts, while a hint might be present for
the QSOs. On the other hand, bulge/disk decompositions are less accurate
for most of the narrow line QSOs, and it is possible that bulge
luminosities in these objects have been overestimated.
-
MB relation, make it very difficult to test whether
the relation between
M and
Mbulge is linear. However, an ordinary least
square fit to the data produces slopes consistent, at the
1
level, with a linear relation for both the QSO and Seyfert 1 samples (cf
Laor 2001).
3.2. AGN Black Hole Demographics from the
M -
Relation
Because of its large intrinsic scatter, there is little more that can be
learned about black hole demographics from the
M -
MB relation. An alternative route is suggested by the
M -
relation for quiescent
galaxies, which exhibits much less scatter.
Very few accurate measurements of
are available in AGNs, due to
the difficulty of separating the bright nucleus from the faint underlying
stellar population. The first program to map AGNs onto the
M -
relation was undertaken by
Ferrarese et al. (2001).
Velocity dispersions in the bulges of six galaxies with reverberation
mapping masses were obtained, thus producing the first sample
of AGNs for which both the black hole mass and the stellar velocity
dispersion are accurately known
(with formal uncertainties of 30% and 15% respectively).
Figure 9 shows the relation between black hole
mass and bulge
velocity dispersion for the six reverberation-mapped AGNs observed by
Ferrarese et al. (2001),
plus an additional object with a high-quality
from the literature
(Nelson & Whittle
1995).
The quiescent galaxies (Sample A from
Ferrarese & Merritt
2000)
are shown by the black dots.
The consistency between black hole masses in active and quiescent
galaxies is even more striking here than in the
M -
Mbulge plot.
The only noticeable difference between the two samples is a slightly
greater scatter in the reverberation mapping masses (in spite of
similar, formal error bars).
Narrow line Seyfert 1 galaxies do not stand out in any way from the
rest of the AGN sample.
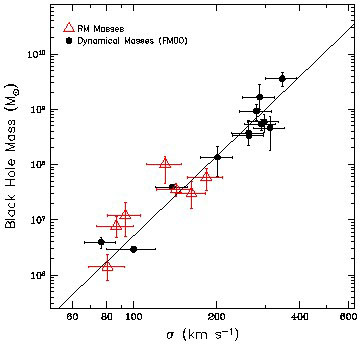
|
Figure 9. Black hole mass versus central velocity dispersion for seven reverberation-mapped AGNs with accurately measured velocity dispersions, compared with the nearby quiescent galaxy sample of Ferrarese & Merritt (2000) (plot adapted from Ferrarese et al. 2001). |
We conclude that there is no longer any prima facie reason to
believe that reverberation-based masses are less reliable than
those based on the kinematics of stars or gas disks.
This is important since the resolution of stellar kinematical studies
will remain fixed at
~ 0".1 for the forseeable future,
whereas reverberation mapping samples a region which is per se
unresolvable and is the only technique that can yield accurate masses
for very small (
106
M ) or very
distant black holes.
) or very
distant black holes.