


Does
M depend
at all on other properties of the host galaxies? A
much-discussed possibility is that
M scales
with the mass of the spheroidal component of the host
(Kormendy 1993;
KR;
Faber et al. 1997;
Magorrian et al. 1998;
Richstone 1998;
Ford et al. 1998;
van der Marel 1999).
The significance of the scatter in the correlation, or whether any
correlation exists at all, is not yet certain. It is somewhat
disconcerting that different authors plotting the same objects do not
always arrive at the
same conclusion. The discrepancies can often be traced to different
assumptions about distances, source of bulge-to-disk decomposition, and
even apparent magnitudes adopted for the host galaxies (e.g., extinction is
not always corrected). The set of host galaxy parameters I adopt is
compiled in Table 1.
depend
at all on other properties of the host galaxies? A
much-discussed possibility is that
M scales
with the mass of the spheroidal component of the host
(Kormendy 1993;
KR;
Faber et al. 1997;
Magorrian et al. 1998;
Richstone 1998;
Ford et al. 1998;
van der Marel 1999).
The significance of the scatter in the correlation, or whether any
correlation exists at all, is not yet certain. It is somewhat
disconcerting that different authors plotting the same objects do not
always arrive at the
same conclusion. The discrepancies can often be traced to different
assumptions about distances, source of bulge-to-disk decomposition, and
even apparent magnitudes adopted for the host galaxies (e.g., extinction is
not always corrected). The set of host galaxy parameters I adopt is
compiled in Table 1.
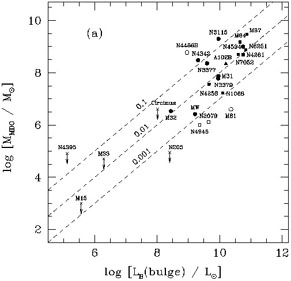
Figure 8 a illustrates that there indeed
appears to be a trend of
M
increasing with bulge mass (luminosity). It is encouraging to
note that the central masses derived from gas and stellar kinematics do not
show any obvious systematic offsets relative to one another.
No obvious differentiation by Hubble type is evident either. As has been
noted by others, the scatter of
M at a
given luminosity is
considerable, at least a factor of 10, perhaps up to 100. The scatter
may have been exacerbated slightly by four possibly anomalous points.
NGC 4486B is a companion to M87, and it appears to have been tidally
truncated; its original luminosity was probably higher. On the other hand,
the bulge luminosity of NGC 4945 could very well have been
overestimated. Its bulge-to-disk ratio was found using the relation of
Simien & de Vaucouleurs
(1986),
which may be inappropriate for a galaxy of such late Hubble type
(Scd). Finally, the masses of M81 and NGC 3079 are quite uncertain and
probably have been underestimated.
|
|
Figure 8. ( a) Log
M |
The trend is much more significant when five upper limits are included.
NGC 205, a dwarf elliptical companion of M31,
contains a blue, compact
nucleus with characteristics resembling an intermediate-age globular
cluster. Its core radius, determined from HST photometry,
combined with a
ground-based measurement of its velocity dispersion yields an upper
limit of 9 × 10⁴
M for any dark mass
(Jones et al. 1996).
The bulgeless, late-type (Scd) spiral M33 also has a stringent upper
limit on its central mass. Its nuclear cluster is extremely tiny (core
radius
for any dark mass
(Jones et al. 1996).
The bulgeless, late-type (Scd) spiral M33 also has a stringent upper
limit on its central mass. Its nuclear cluster is extremely tiny (core
radius
 0.39 pc), and
its central velocity dispersion is 21 km s-1;
Kormendy & McClure (1993)
put an upper limit of
M
0.39 pc), and
its central velocity dispersion is 21 km s-1;
Kormendy & McClure (1993)
put an upper limit of
M
 5 × 10⁴
M. NGC 4395 in
some ways resembles M33, but it is even more extreme. The nucleus is
optically classified as a type 1.8 Seyfert (broad
H
5 × 10⁴
M. NGC 4395 in
some ways resembles M33, but it is even more extreme. The nucleus is
optically classified as a type 1.8 Seyfert (broad
H and
H
and
H present),
emits a largely nonstellar featureless continuum that extends into the UV
(Filippenko, Ho, & Sargent
1993),
and displays variable
soft X-ray emission and a compact flat-spectrum radio core
(Moran et al. 1999).
These properties alone would be unremarkable were it not for the
fact that the nucleus has an absolute blue magnitude of only -9.8 and lives
in a Magellanic spiral 2.6 Mpc away!
Filippenko & Ho (1998)
detected the
Ca II infrared triplet lines in absorption from echelle spectra taken
with the Keck telescope, from which they were able to estimate the
strength of the stellar component contributing to the nuclear light
(MB = -7.3 mag) and the central stellar velocity
dispersion (
present),
emits a largely nonstellar featureless continuum that extends into the UV
(Filippenko, Ho, & Sargent
1993),
and displays variable
soft X-ray emission and a compact flat-spectrum radio core
(Moran et al. 1999).
These properties alone would be unremarkable were it not for the
fact that the nucleus has an absolute blue magnitude of only -9.8 and lives
in a Magellanic spiral 2.6 Mpc away!
Filippenko & Ho (1998)
detected the
Ca II infrared triplet lines in absorption from echelle spectra taken
with the Keck telescope, from which they were able to estimate the
strength of the stellar component contributing to the nuclear light
(MB = -7.3 mag) and the central stellar velocity
dispersion (
 30 km s-1).
Combining the velocity dispersion with a cluster size (r
0.7 pc)
obtained from HST images, Filippenko & Ho limit the central
mass to 8 ×
104
M. The Circinus
galaxy is thought to house a Seyfert
nucleus, and if it contains a SMBH, its mass within
r 10 pc has
been constrained to be
4 ×
106
M
(Maiolino et al. 1998).
The last upper limit shown in the figure pertains to the globular
cluster M15; following KR, I adopt an upper limit of
M = 1
× 103
M.
30 km s-1).
Combining the velocity dispersion with a cluster size (r
0.7 pc)
obtained from HST images, Filippenko & Ho limit the central
mass to 8 ×
104
M. The Circinus
galaxy is thought to house a Seyfert
nucleus, and if it contains a SMBH, its mass within
r 10 pc has
been constrained to be
4 ×
106
M
(Maiolino et al. 1998).
The last upper limit shown in the figure pertains to the globular
cluster M15; following KR, I adopt an upper limit of
M = 1
× 103
M.
However, before reading too much into this diagram, we should ask whether the apparent correlation might arise from selection effects. The absence of points on the upper left-hand corner is probably real; there is nothing preventing us from detecting a massive BH in a small galaxy. Yet, we should be cautious, because very few low-mass galaxies have been studied so far, most of the effort having been focused on luminous, early-type systems. On the other hand, the empty region on the lower right-hand corner could be an artifact. Small masses are difficult to detect at large distances, and most luminous galaxies are far away. So the apparent correlation could be an upper envelope. Future observations are needed to settle this issue.
The median value of
M /
LB(bul) for the 20 detected
objects is 0.012, which translates into a mass ratio of 0.002 for
M / LB
6 typical for old
stellar populations
(van der Marel 1991).
That is, on average about 0.2% of the bulge mass is locked up in the form
of a SMBH.
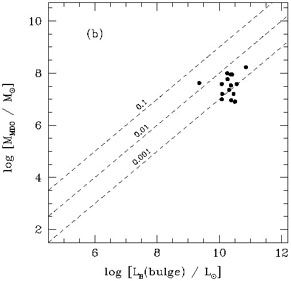
Magorrian et al. (1998)
constructed axisymmetric f (E, Lz)
models for a sample of 32 early-type (mostly E and S0) galaxies having both
HST photometry and ground-based stellar kinematics data, and they
concluded that the data are consistent with nearly all of the galaxies
having SMBHs. The 29 detected objects have a median
M /
Mbul
0.005, higher than found
here. However, as
Magorrian et al. realize, the assumption of a two-integral distribution
function may have caused them to overestimate
M
(cf.
van der Marel 1999).
Interestingly, quasars possibly also obey a similar
M-Mbul relation.
McLeod (1998)
finds that, for the most
luminous quasars, there exists a minimum host luminosity that increases
with nuclear power. Assuming that the quasar luminosities correspond to
energy generation at the Eddington rate,
M /
Mbul is again ~ 0.002
(McLeod 1998).
With regard to the dead quasar prediction discussed in
Section 1, recall that
we expect to find on average a 107
M BH for every
LB
1010 L
galaxy, or
M /
LB(bul)
3.3 ×
10-3
M /
L since bulges
contribute typical 30% of
the galaxy light in B
(Schechter & Dressler
1987).
Evidently, if
 = 0.1, we have already
found about three times that value. This implies that either
is smaller than 0.1, or
that quasars do not make up all of the AGN population.
= 0.1, we have already
found about three times that value. This implies that either
is smaller than 0.1, or
that quasars do not make up all of the AGN population.