


Contrary to the ambiguity of light profiles, the Keplerian rise in the
velocity dispersion toward the center,
 (r)
(r)
 r-1/2,
is a robust prediction for a wide variety of dynamical models containing a
central massive dark object (MDO;
Quinlan et al. 1995).
Sargent et al. (1978)
noticed that the innermost
velocities of M87 were consistent with such a prediction, and,
assuming an
isotropic velocity distribution, they inferred that the center of this
galaxy contained a dark mass of ~ 5 × 10⁹
M
r-1/2,
is a robust prediction for a wide variety of dynamical models containing a
central massive dark object (MDO;
Quinlan et al. 1995).
Sargent et al. (1978)
noticed that the innermost
velocities of M87 were consistent with such a prediction, and,
assuming an
isotropic velocity distribution, they inferred that the center of this
galaxy contained a dark mass of ~ 5 × 10⁹
M , presumably in
the form of a SMBH. The central rise in
(r), unfortunately,
can be insidiously
mimiced by an anisotropic velocity distribution, and therefore an MDO is
not required by the data for this object
(Duncan & Wheeler 1980;
Binney & Mamon 1982;
Richstone & Tremaine
1985;
Dressler & Richstone 1990;
van der Marel 1994a).
This degeneracy presents a serious difficulty for many mass
determinations based on stellar kinematic data. An extensive and lucid
discussion of this vast subject was presented by KR, and many of the
details will not be repeated here. Nonetheless, an abbreviated synopsis
is needed to motivate the topic.
, presumably in
the form of a SMBH. The central rise in
(r), unfortunately,
can be insidiously
mimiced by an anisotropic velocity distribution, and therefore an MDO is
not required by the data for this object
(Duncan & Wheeler 1980;
Binney & Mamon 1982;
Richstone & Tremaine
1985;
Dressler & Richstone 1990;
van der Marel 1994a).
This degeneracy presents a serious difficulty for many mass
determinations based on stellar kinematic data. An extensive and lucid
discussion of this vast subject was presented by KR, and many of the
details will not be repeated here. Nonetheless, an abbreviated synopsis
is needed to motivate the topic.
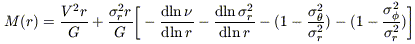
Following the notation of KR, the radial variation in mass can be expressed by the first velocity moment of the collisionless Boltzman equation,
|
where V is the rotational velocity,
r is the radial and
 and
and
 the azimuthal components of
the velocity dispersion, and
the azimuthal components of
the velocity dispersion, and  is
the density of the tracer population.
In practice, several simplifying assumptions are adopted: (1) the mass
distribution is spherically symmetric; (2) the mean rotation is circular;
and (3) is proportional to the
luminosity density, or,
equivalently, that M/L does not vary with radius.
is
the density of the tracer population.
In practice, several simplifying assumptions are adopted: (1) the mass
distribution is spherically symmetric; (2) the mean rotation is circular;
and (3) is proportional to the
luminosity density, or,
equivalently, that M/L does not vary with radius.
A brief scrutiny of the above equation indicates that the effects of
velocity anisotropy can have a large and complicated effect on the
derivation of M(r)
because the terms inside the bracket significantly affect the
r2
r / G term. If
r >
and r >
, each of the last two terms
will be negative
and can be as large as -1. The central brightness distributions of the
spheroidal component of most galaxies typically have
- (dln /
dln r)  +
1.1 for luminous, nonrotating systems and
+
1.1 for luminous, nonrotating systems and
 +2 for low to
intermediate-luminosity systems (e.g.,
Faber et al. 1997).
Since - (dln
r2 /
dln r)
+2 for low to
intermediate-luminosity systems (e.g.,
Faber et al. 1997).
Since - (dln
r2 /
dln r)  + 1,
it is apparent that, under suitable conditions, all four terms can largely
cancel one another. As emphasized by KR, all else being equal, smaller,
lower luminosity galaxies such as M32 potentially yield more secure mass
determinations than massive galaxies like M87 because less luminous systems
tend to have (1) steeper central light profiles, (2) a greater degree of
rotational support, and (3) less anisotropy.
+ 1,
it is apparent that, under suitable conditions, all four terms can largely
cancel one another. As emphasized by KR, all else being equal, smaller,
lower luminosity galaxies such as M32 potentially yield more secure mass
determinations than massive galaxies like M87 because less luminous systems
tend to have (1) steeper central light profiles, (2) a greater degree of
rotational support, and (3) less anisotropy.
The principles behind the stellar kinematics analysis are conceptually
straightforward but in practice technically challenging. Given the
set of observed quantities I(r), V(r), and
(r), the goal is to
derive a range intrinsic values for these quantities after accounting for
projection and the blurring effects of seeing. Much of the machinery for
these tasks has been developed and extensively discussed by Kormendy
(1988a,
b) and
Dressler & Richstone
(1988).
The sensitivity of the
results to the effects of anisotropy are examined through maximum-entropy
dynamical models
(Richstone & Tremaine
1984,
1988)
to see whether conclusions regarding the presence of MDOs can be obviated
by a suitable exploration of parameter space. Perhaps the most serious
limitation of these maximum-entropy models is that they do not properly
take flattening into account.
The last several years have seen a resurged interest in improving the techniques of analyzing stellar kinematics data. In the context of SMBH searches, Gerhard (1993), van der Marel et al. (1994a, b), Dehnen (1995), among others, have stressed the importance of utilizing the full information contained in the velocity profile or line-of-sight velocity distribution (LOSVD) of the absorption lines, which are normally treated only as Gaussians. A system with significant rotation, for instance, can leave a measurable skewness on the LOSVD, while various degrees of anisotropy would imprint symmetric deviations from a Gaussian line shape. Neglecting these subtleties can lead to systematic errors in the measurement of V(r), but in the cases best studied so far these effects do not seem to have been severe (KR). Furthermore, the line profile should develop weak, high-velocity wings if a SMBH is present (van der Marel 1994b), although the currently available data do not yet have the requisite quality to exploit this tool.
Yet another advance has focused on the development of dynamical models with two-integral phase-space distribution functions, f (E, Lz), E being the total energy and Lz the angular momentum in the symmetry axis (van der Marel et al. 1994b; Qian et al. 1995; Dehnen 1995). Such models are properly flattened, and they generate predictions for the LOSVDs; on the other hand, it is not clear whether imposing a special dynamical structure is too restrictive. This limitation will be eliminated by fully general, axisymmetric three-integral models (van der Marel et al. 1998; Cretton et al. 1999; Gebhardt et al. 1998).
There are currently 10 galaxies with published MDO measurements determined
from stellar kinematical data (Table 1).
Of these, only three (M81:
Bower et al. 1996;
NGC 3379:
Gebhardt et al. 1998;
NGC 4342:
van den Bosch 1998)
come solely from HST data; the remaining ones, although
many by now confirmed with HST, were initially discovered
from high-quality ground-based observations (see KR for a detailed account
of each object). Kormendy and collaborators, in particular, making use of
the excellent seeing conditions and instrumentation on the CFHT,
continue to make progress in this area. Two new MDOs have been reported
recently based
on CFHT data: the low-luminosity elliptical galaxy NGC 4486B has
MMDO = 6 × 10⁸
M
(Kormendy et al. 1997b),
and NGC 3377, another close cousin, has
MMDO = 2.3 × 10⁸
M
(Kormendy et al. 1998).
This demonstrates the important fact that
even in the HST era ground-based observations continue to play an
important role in SMBH searches.
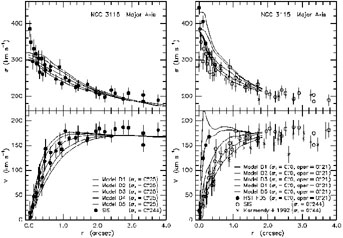
The new observations with HST, thus far all acquired using the Faint Object Spectrograph (FOS), provide an important contribution by increasing the angular resolution by about a factor of 5 compared to the best ground-based data available. In all cases studied (NGC 3115: Kormendy et al. 1996; NGC 4594: Kormendy et al. 1997a; M32: van der Marel et al. 1997; M31: Ford et al. 1998), the velocity dispersions continue to rise toward smaller r and the maximum rotational velocity has generally increased (Fig. 1). In the case of NGC 3115, the FOS spectra are of sufficient quality to reveal wings in the LOSVD that extend up to ~ 1200 km s-1 (Kormendy et al. 1996). The HST data thus considerably bolster the case for a MDO in these objects. The improvement in angular resolution additionally strengthens our confidence that the MDOs might indeed be SMBHs. A reduction of the size scale by a factor of 5 increases the central density by more than two orders of magnitude. Although in general this is still not enough to rule out alternative explanations for the dark mass (Section 6), it is clearly a step in the right direction.
|
Figure 1. Stellar kinematic data for
NGC 3115 compared with various dynamical models (see
Kormendy et al. 1996).
The left panel shows
the best ground-based data, and the right panel the same data with
new HST data superposed for comparison. Both V and
|
I conclude this section with a few remarks on the dark mass in
the Galactic Center (see Ozernoy in these proceedings for more details),
which, in my view, is now the most compelling case of a SMBH in any
galactic nucleus. From analysis of an extensive set of near-IR radial
velocities of individual stars, coupled with
additional measurements from the literature, Genzel et al.
(1996;
see also
Krabbe et al. 1995)
found a highly statistically significant rise in the radial
velocity dispersion between 5 and 0.1 pc from the dynamical center.
Assuming
an isotropic velocity distribution, the observations require a dark mass
of ~ 3 × 10⁶
M within r =
0.1 pc and
M/LK  100;
the dark mass must have a density in excess of 109
M
pc-3, which argues strongly for it being a SMBH. These
conclusions, and a suspicion nearly three decades old
(Lynden-Bell & Rees 1971),
have finally been vindicated by recent measurements of stellar proper
motions within the central 1 pc region using high-resolution
K-band astrometric maps
(Eckart & Genzel 1996,
1997;
Genzel et al. 1997;
Ghez et al. 1998).
The main results are the following: (1) the stellar radial velocities
agree
with the proper motions, which implies that on average the velocities are
close to isotropic; (2) the combined velocities imply a dark mass
(Fig. 2)
within 0.006 pc of 2.61 × 10⁶
M
(Genzel et al. 1997
quote a statistical error of ± 0.15 and a combined statistical and
systematic error of
± 0.35); (3) the density, therefore, has an astonishingly high
value of >2 × 10¹²
M pc-3,
which leaves almost no room to escape the
conclusion that the dark mass must be in the form of a SMBH
(Section 6). The
presence of a large mass is also supported by the detection of several
stars, within 0.01 pc from the central radio source Sgr A*, moving
at speeds in
excess of 1000 km s-1. From the velocities of the
fast-moving stars and the near
stationarity of Sgr A*, Genzel et al. further use equipartition
arguments to constrain the mass of the radio core itself
( 105
M), which, when
combined with the exceedingly small upper limit
for its size (r < 4 × 10⁻⁶ pc), would imply a
density of > 3 × 10²⁰
M pc-3.
100;
the dark mass must have a density in excess of 109
M
pc-3, which argues strongly for it being a SMBH. These
conclusions, and a suspicion nearly three decades old
(Lynden-Bell & Rees 1971),
have finally been vindicated by recent measurements of stellar proper
motions within the central 1 pc region using high-resolution
K-band astrometric maps
(Eckart & Genzel 1996,
1997;
Genzel et al. 1997;
Ghez et al. 1998).
The main results are the following: (1) the stellar radial velocities
agree
with the proper motions, which implies that on average the velocities are
close to isotropic; (2) the combined velocities imply a dark mass
(Fig. 2)
within 0.006 pc of 2.61 × 10⁶
M
(Genzel et al. 1997
quote a statistical error of ± 0.15 and a combined statistical and
systematic error of
± 0.35); (3) the density, therefore, has an astonishingly high
value of >2 × 10¹²
M pc-3,
which leaves almost no room to escape the
conclusion that the dark mass must be in the form of a SMBH
(Section 6). The
presence of a large mass is also supported by the detection of several
stars, within 0.01 pc from the central radio source Sgr A*, moving
at speeds in
excess of 1000 km s-1. From the velocities of the
fast-moving stars and the near
stationarity of Sgr A*, Genzel et al. further use equipartition
arguments to constrain the mass of the radio core itself
( 105
M), which, when
combined with the exceedingly small upper limit
for its size (r < 4 × 10⁻⁶ pc), would imply a
density of > 3 × 10²⁰
M pc-3.
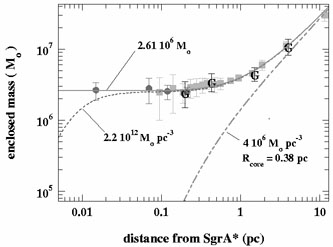
|
Figure 2.
Enclosed mass versus radius for the Galactic Center derived from
stellar radial velocities and proper motions (from
Genzel et al. 1997).
The points labeled with "G" come from gas kinematics. The thick
dashed curve is a model for the stellar cluster with a total mass
density of 4 × 10⁶
M |