 seems to have well understood errors, but with outliers
beyond that expected for Gaussian statistics.


11.4 Conclusions
The overall agreement between the various distance methods is quite good, but there is room for improvement. SBF and PNLF have a small but significant difference in scale when the same galaxies are compared. SBF agrees well with TF in zero point, but this could be fortuitous if the spirals and ellipticals have conspired to mask a real difference.
The primary results of the comparison are:
(i) SBF and PNLF have errors which are approaching 5%, but each seems to have a poorly understood systematic component of about 5%.
(ii) The GCLF appears to be more accurate than expected, but possibly has a scale error in the sense of overestimating distances by about 13%.
(iii) SN Ia have larger errors than expected, but there is reason to believe that this will improve dramatically as newer data become available.
(iv) Dn- seems to have well understood errors, but with outliers
beyond that expected for Gaussian statistics.
(v) TF also may have well understood errors, but a literal interpretation of the distance to an elliptical group may be misleading when the spirals are not well intermixed.
Finally, what about the Hubble constant? All of the distances above, except those from SNe Ia, are based on the RR Lyrae/Cepheid distance scale, and these distances would change proportionately to any change in that scale. It seems unlikely for that scale to change by more than 10%, given that the Magellanic Clouds have so many independent distance estimates, but it is important to bear in mind that the Hubble ratios above are based on an assumption about the distance to M31 and other local calibrators.
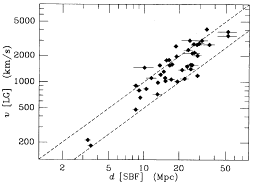
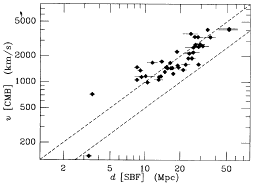
Figure 30 illustrates another difficulty. The top left panel shows recession velocity in the LG frame plotted against SBF distance, and the bottom panel shows recession velocity in the CMB frame. It is clear that the CMB frame is inappropriate for nearby galaxies; as has been stressed many times (e.g., Yahil et al. 1977), the local Hubble flow is quite symmetric and linear around the LG frame. Thus, one must use the LG frame to understand the Hubble flow of nearby galaxies.

| 
|

| Figure 30. Various velocities are plotted against SBF brightness. The top left-hand panel shows recession velocity in the LG frame, and the bottom panel shows recession velocity in the CMB frame. The two dashed lines show H0 = 50 and 100 km s-1 Mpc-1. The top right-hand panel shows a velocity in the LG frame which has been corrected for the effect of 300 km s-1 of Virgo infall. |
One could interpret the top left panel of Figure 30 as evidence that the global value of H0 is 50 km s-1 Mpc-1, and that the deviation of the points starting at about 10 Mpc indicates that all the distance estimators described here share a common bias. An alternative interpretation is that the Hubble ratios near 50 km s-1 Mpc-1 are the effect of the compression from 85 km s-1 Mpc-1 by a 300 km s-1 infall into the Virgo cluster. The upper right panel of Figure 30 shows that removal of this effect tightens the velocity distance relation considerably, and moves all of the points closer than 20 Mpc up to about 85 km s-1 Mpc-1 (on the SBF or T-F scales).
The evidence presented in this article favors a Hubble constant of about 85 km s-1 Mpc-1 (on the SBF or T-F scales), with rather small uncertainty and good agreement among all the various methods. The Hubble constant would be 6% and 13% smaller if placed on the PNLF or GCLF scales, respectively.
We can also derive the Hubble constant directly from our Virgo
averages. There is some question, however, as to the proper velocity
to assign to the Virgo cluster; instead we adopt the approach in
which
the more far-reaching techniques (e.g., Type Ia supernovae,
Dn- ,
Tully-Fisher) are used to obtain the distance ratio,
5.6 ± 0.5, for Coma relative to Virgo
(Aaronson et al. 1986;
Dressler et al. 1987b;
Lucey et al. 1991b;
Sandage and Tammann
1990).
The recessional velocity for Coma is 7160 ± 200 after correcting
for Virgocentric infall
(Pierce 1989;
Sandage and Tammann
1990).
These values yield H0 = 73 ± 11 (unweighted Virgo
average) and H0
= 80 ± 11 (weighted Virgo average) based on the
Freedman and Madore
(1990)
distance to M31 and an M31 differential reddening value of E
(B - V) =
0.08. These values will be 8.5% higher if the
Welch et al. (1986)
Cepheid distance for M31 is adopted. Similarly, the values will be 6%
higher if we adopt the M31 distance of 725 kpc based on a variety of
methods
(van den Bergh 1991).