Copyright © 1991 by Annual Reviews. All rights reserved
| Annu. Rev. Astron. Astrophys. 1991. 29:
543-79 Copyright © 1991 by Annual Reviews. All rights reserved |


The simplest statistic describing a GCS is the total number of clusters Nt. Hanes (77) and Harris & Racine (108) demonstrated to first order that for a given type of galaxy, Nt scaled directly with galaxy luminosity. The specific frequency (111) is defined as the cluster population normalized to MVT = -15,
Table 1 lists values for
SN. These have all been
recalculated from the published cluster counts as described in
Section 2, and make up a new and
homogeneous catalog of specific frequencies. The quoted
internal uncertainties on SN include the given errors in
both the raw counts Nobs and the ± 0.2-mag uncertainty
in
In spite of its approximate nature,
very real differences in SN from galaxy to galaxy do exist.
The prototype high-SN system M87 has repeatedly been
shown to have two to three times more clusters per unit
luminosity than do the other Virgo ellipticals; these, in
turn, are quite a bit more cluster-rich than most of the field
ellipticals. No obvious correlations of SN with
parameters such as
MVT (see Figure 4)
or galaxy ellipticity have been found.
However, significant mean differences appear with
environment, as is summarized in Table 3. By and
large, the
ellipticals in smaller groups and sparser environments contain
approximately two times fewer clusters for their size than those in rich
environments (Virgo, Fornax). The few dwarf ellipticals in
the list have specific frequencies that are no different in
the mean from the giants, indicating that they were at least
as efficient per unit mass at forming clusters as were
the bigger galaxies. An outstanding and still quite
puzzling exception is the Fornax dwarf in the Local Group (68);
its SN
For disk galaxies, SN is harder to interpret directly since
MVT includes the disk and Population I
light, which is
generically less related to the halo clusters. For these, an
adjusted quantity SN* is usually used (cf
91,
214), which is
the ratio of Nt to
only the spheroid light specifically excluding the disk.
For Sa/Sb galaxies, reasonably accurate estimates of
SN* can be made since the spheroid makes up
a large fraction of the total light (49a). For Sc/Irr types,
however, the fraction of light belonging to the old spheroid
(if any!) is too small and uncertain to permit any sensible
conversion from SN to
SN*, at least in optical
bandpasses. It is nevertheless
remarkable that, even with vanishingly small amounts of the
oldest stellar populations, these late-type galaxies have
still managed to produce very old clusters in noticeable numbers
(184a). This
property of the very late-type galaxies such as M33 and the LMC
suggests, as does much other evidence to be discussed in the
following sections, that the GCS and halo formation processes were at
least partly decoupled.
The specific frequency was introduced as a way to remove
the first-order proportionality of Nt to galaxy size and
thus to compare systems more easily. But it turned out also to be
an interesting discriminator for ideas by
Toomre (196)
and others about the formation of E galaxies by mergers.
As a ratio of clusters to field halo stars, SN is
relatively invariant to
interactions between galaxies, because both
stars and clusters alike behave essentially as massless test
particles. Thus in a collision between two galaxies,
SN (or SN* for disk
systems) for the merged product will be a luminosity-weighted
average between the two (or somewhat smaller
if the remnant is stripped of gas and the age-dimmed disk
light eventually joins the spheroid). The typical
SN* for
Sa/Sb galaxies (see Table 3) is similar to
SN for E
galaxies in smaller groups, but significantly smaller than in
the Virgo Es or the dwarfs. On this basis, Harris (91)
suggested that spirals were fundamentally less efficient at
forming globular clusters than were the Virgo ellipticals,
and that the lower specific frequencies for field and
small-group ellipticals might be explained by their higher
expected merger rates; that is,
many of the large ellipticals with the
lowest SN values might indeed be remnants of long-past disk
mergers.
The high SN
values found in the rich Virgo and Fornax ellipticals
have several implications repeatedly emphasized by van den Bergh
(202,
203,
204,
205,
207,
208,
212).
It appears highly improbable that galaxies,
with low specific frequencies(such as present-day disk galaxies), could
have merged to form these cluster-rich ellipticals. Finally, it
is especially difficult to understand the existence of the huge
cluster populations around the central giant ellipticals M87,
NGC 1399,
NGC 3311,
and (possibly) NGC 4874
in any way involving mergers of normal galaxies that had already
fully formed. These rare high-SN supergiant systems all sit
very close to the dynamical centers of rich
clusters (99),
and almost certainly were unusual from the start. However, whether they
represent just the upper end of a continuum of SN values
(Figure 4) or if they are truly distinct remains
unclear. In M87, the
characteristics of the globular clusters themselves (colors,
metallicities, space distribution, and luminosity distribution)
are no different
from those within the more normal big ellipticals.
In other words, the only distinguishing characteristic
of clusters in the high-SN systems appears to be their
sheer numbers.
With the salient exceptions noted above, there remains a
remarkable first-order uniformity from galaxy to galaxy in the
number of globular clusters per unit halo
(spheroidal-component) luminosity over a vast range of sizes.
An average SN
Though useful for rough comparisons, SN is unavoidably
an imprecise parameter.
A potentially better index of the contribution of
the GCS to the total galaxy population is one that I will
define here as the specific luminosity SL,
Here, Lcl denotes the summed visual luminosity of all the
globular clusters in the galaxy, and LT the luminosity of
the galaxy itself; MVcl and
MVT are the
corresponding integrated magnitudes. (SL can of course be
defined equally well in any bandpass; V is adopted
here only for convenience.) The ratio SL is
simply the percentage of the total galaxy light contributed by
the globular clusters. Although it requires more complete
photometric information to measure than does SN, note that
SL has several advantages, listed below.
Wagner et al. (219) have used a similar quantity
to trace the radial structure of the GCS in NGC 1399.
Probably the best galaxy to act as a reference standard for
SL is M49; with both a well sampled GCLF and full
radial profile available, it is the most well understood
``normal'' GCS among the large ellipticals. Its SL(r)
profile is plotted in Figure 5: Globally,
SL =
 Nt · 10-0.4
(MVT + 15) .
Nt · 10-0.4
(MVT + 15) .
 (GCLF), but not the
potential errors in distance modulus or limiting magnitude.
As a rule of thumb, the
specific frequency for any particular galaxy should be regarded as
valid to roughly a factor of two. Except for the few
best-studied systems, the combined
uncertainties in the cluster counts, galaxy luminosities,
and the extrapolations necessary to estimate Nt over
all magnitudes and radii, prevent any higher precision.
(GCLF), but not the
potential errors in distance modulus or limiting magnitude.
As a rule of thumb, the
specific frequency for any particular galaxy should be regarded as
valid to roughly a factor of two. Except for the few
best-studied systems, the combined
uncertainties in the cluster counts, galaxy luminosities,
and the extrapolations necessary to estimate Nt over
all magnitudes and radii, prevent any higher precision.
 70 is by far the highest in the list, and too
anomalous to be easily ascribed just to small-number
statistics.
70 is by far the highest in the list, and too
anomalous to be easily ascribed just to small-number
statistics.
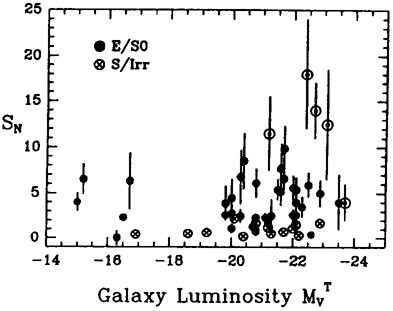
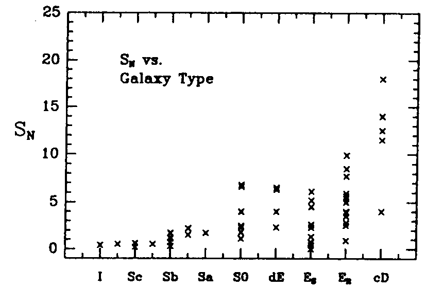
Figure 4. Specific frequency SN of globular
cluster
systems, as listed in Table 1.
In the upper panel, SN is plotted versus the
luminosity of the parent galaxy; E/S0 types are denoted by the
filled symbols, and spiral/irregular types by the crosses. The
five giant ellipticals at the
centers of rich clusters (Virgo, Fornax, Hydra, Coma, A2199)
are denoted by the circled dots. In the lower panel, SN
is plotted against morphological type. Here ES and
ER
refer to ellipticals in sparse and rich clusters, and the last
bin (cD) again denotes the central-giant ellipticals.
Galaxy Type
<SN>
N
Comment
Sc/Irr
0.5 ± 0.2
4
Sa/Sb
1.2 ± 0.2
9
<SN*>  2.1 ± 0.4
E/S0 (Small Groups)
2.6 ± 0.5
13
E/S0 (Virgo, Fornax)
5.4 ± 0.6
15
excludes M87, N1399
dE
4.8 ± 1.0
4
excludes Fornax, M32
4
corresponds to one cluster per MV(halo) = -13.5, or in terms
of mass, of order 1 M in globular clusters per
~ 103 M in field-star mass. This ratio is very close
to that estimated from formation efficiency arguments
(e.g. 126; see
Section 7).
100
· Lcl / LT = 100.4
(MVT - MVcl +
5)
in globular clusters per
~ 103 M in field-star mass. This ratio is very close
to that estimated from formation efficiency arguments
(e.g. 126; see
Section 7).
100
· Lcl / LT = 100.4
(MVT - MVcl +
5)
1.
As a luminosity ratio, SL is strictly independent
of the assumed distance.
2.
It is utterly insensitive to the details of the
faint half of the cluster luminosity function, thus is easier
than SN to calculate accurately for more distant
galaxies. (2)
3.
SL can readily be defined locally as well as
globally within the galaxy; for example, the spatial variation
in cluster population could be traced out by calculating
SL(r) within radial annuli around the galaxy center.
 2
2  r
SL(r) dr equals 1%, but locally it increases
drastically from center to outer halo. This effect is a manifestation of the
more extended spatial structure of the GCS compared with the halo light,
discussed again in the next section. Because the clusters
are bluer than the integrated galaxy
light (Section 6), SL will
vary somewhat with adopted
wavelength. For example, if SL equals 1% in B, then
it will be roughly 1.2% in U, 0.8% in V, and 0.6% in
I.
r
SL(r) dr equals 1%, but locally it increases
drastically from center to outer halo. This effect is a manifestation of the
more extended spatial structure of the GCS compared with the halo light,
discussed again in the next section. Because the clusters
are bluer than the integrated galaxy
light (Section 6), SL will
vary somewhat with adopted
wavelength. For example, if SL equals 1% in B, then
it will be roughly 1.2% in U, 0.8% in V, and 0.6% in
I.
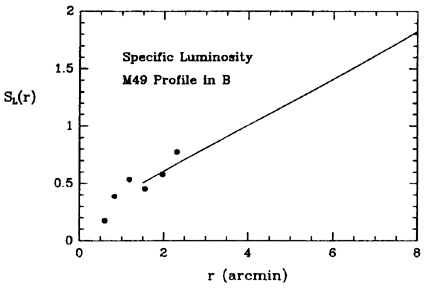
Figure 5. The local specific luminosity profile
for the giant elliptical M49, in B light. Here
SL(r) is
the ratio (in units of percentage) of the total light
from the globular clusters to the light from the halo, at
projected radius r from the galactic center. The solid dots
are six radial points sampled using
CCD photometry of the clusters (103).
SL(r) increases with radius because the
clusters follow a
spatially more extended distribution than the halo, thus are
relatively more common at larger radii. The solid line is
derived from the difference
between the r1/4 profile curves describing the halo and
the GCS (94); it
is used here to show schematically
the radial increase of SL(r). Integrating this
profile over all
radii gives the global specific luminosity SL, which
for M49 is close to 1% in B.
2 Clearly Lcl, and
hence SL, are obtained by integrating the LWLF
function  (m) over all
magnitudes. Because the clusters brighter than
m0 make up fully 90% of the total cluster
light, the relative numbers of the fainter ones need
not be known accurately. Back.
(m) over all
magnitudes. Because the clusters brighter than
m0 make up fully 90% of the total cluster
light, the relative numbers of the fainter ones need
not be known accurately. Back.