
This element has been known since remote times. The name comes from the Latin word carbo (charcoal).
Ionization energies
CI 11.3 eV, CII 24.4 eV, CIII 47.9 eV, CIV 64.5 eV, CV 392 eV.
Absorption lines of CI
| 4771(6) | 10 685 + 10 691(1) | |||
| Group | V | Ib | V | III |
| B 6 | 0.05 | |||
| A 0 | 0.76 | |||
| A 2 | 0.003 | 0.96, 1.16 | ||
| A 3 | 1.12, 1.25 | |||
| A 4 | 1.39 | |||
| A 5 | 1.41 | 1.64 | ||
| A 7 | 0.06 | 1.38 | 1.75 | |
| F 0 | 0.158(Ia) | 1.22 | ||
| F 1 | 1.86 | |||
| F 5 | 0.05, 0.021 | 0.06, 0.031 | ||
| F 6 | 1.84 | |||
| F 8 | 0.045 | |||
| G 0 | ||||
| S | 0.015 | 0.18 | ||
| K 0 | 0.015 | |||
| K 2 | 0.013(III) | |||
| Note that the resonance line is 8335(10). | ||||
Many CI lines are present in the ultraviolet spectrum - among others 1657 (UV2), 1931(33) - a few weak ones in the photographic region and some stronger lines in the infrared.
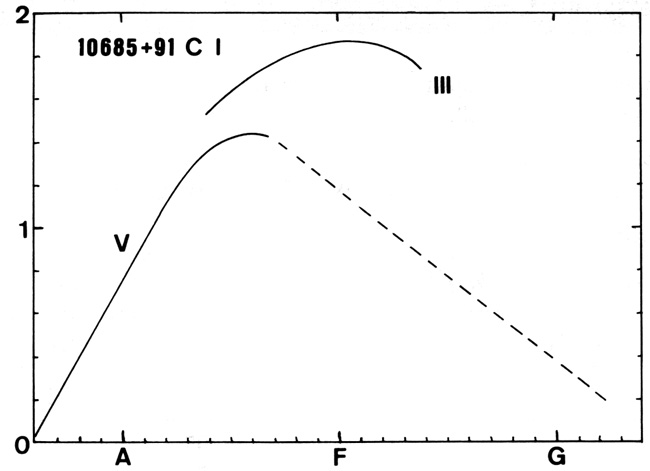
The infrared lines (10685+91(l)) are seen from mid-B-type stars, with a maximum around A 6. In the sun these lines are very weak. A positive luminosity effect is present.
In C-type stars the [CI] line 8727 is prominent (Fujita 1992).
 |
Emission lines of CI
When the CI line 1993 (UV 32) is seenin emission from late type stars it indicates the presence of a chromosphere; the line is, however, never very intense. It is observed mostly in C- and K-type dwarfs. See also Part Two, section 3.1.
Absorption lines of CII
| Group | V | III | Ia |
| O 9 | 0.04 | ||
| 0 9.5 | 0.067 | ||
| B 0 | 0.082 | 0.095 | |
| B 1 | 0.134 | 0.135 | |
| B 2 | 0.219 | 0.155 | |
| B 3 | 0.161 | 0.22(Iab) 0.427(Ia) | |
| B 5 | 0.118 | 0.29(Ib) | |
| B 6 | 0.145 | 0.132 | |
| B 7 | 0.071 | 0.11 | |
| B 8 | 0.062 | 0.190,0.170 | |
| B 9 | 0.02 | ||
| A 0 | 0.05,0.080 | ||
| A 1 | 0.003 | ||
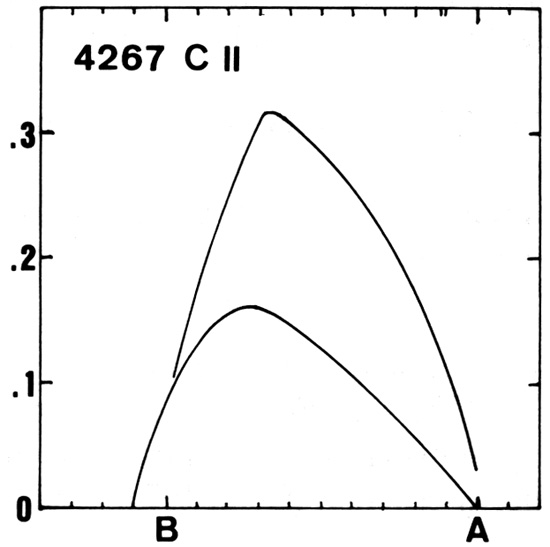
C II lines are present in the ultraviolet region (for instance 1335(U 1)) and in the photographic region, where there exist some medium strength lines. The 4267(6) line appears in late 0-type stars and disappears at late B-type, with a maximum around B 5 and a positive luminosity effect. CII 6578-6583(2) lines are very strong from B 2 to B 5 supergiants (Walborn 1980). Barnett and McKeith (1988) analyzed a series of measurements of these lines in B-type stars and concluded that they should be preferred for abundance analysis over the lines in the photographic region.
The ultraviolet CII line 1335 decreases from early B-type to B 8, where it disappears (Heck et al. 1984).
 |
Emission lines of CII
For WR stars see later.
When the CII 1335(l) line is seen in late type spectra it indicates the existence of a chromosphere. See the discussion on chromospheres. The line is prominent in F, G and K dwarfs.
Absorption lines of CIII
| Group | V | III | I |
| 0 7 | 0.04 | 0.15(f) | |
| 0 8 | 0.15 | ||
| 0 9 | 0.225 | ||
| B 0 | 0.155 | 0.530 | |
| B 1 | 0.215 | ||
| B 2 | 0.020 | ||
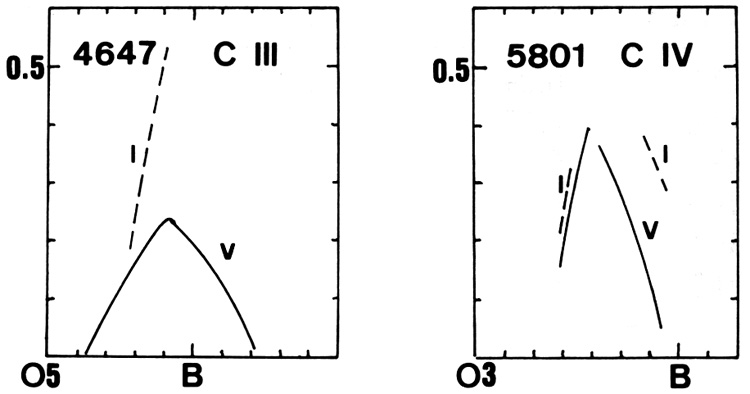
C III lines (for instance 4647) appear at about 0 7 and disappear at B 0.5, with a maximum around 0 9.5. This line has a very pronounced positive luminosity effect.
The ultraviolet C III feature at 1175 (UV 4) is visible between 0 4 and B 6, with a maximum at B 1.
The infrared C III line 8500 is always found in absorption in O and Of stars (Mihalas et al. 1975).
Emission lines of CIII
The 1175(4) feature and the resonance line at 977(1) have been found in emission in the ultraviolet spectrum of the sun (Feldman and Doschek 1991).
The C III 5696(2) line is seen in emission in supergiants between O 6 and O 9.5 and constitutes a good luminosity criterion (Conti 1974, Walborn 1980).
For WR stars see later.
Absorption lines of CIV
| 5801(1) | 1550(UV 1) | ||||
| Group | V | I | V | III | I |
| 0 6 | 0.2 | 0.25(f) | 10 | 12 | 12 |
| 0 7 | 0.400 | 9.5 | 11.5 | 12 | |
| 0 9 | 0.09 | 06.5 | 10 | 11 | |
| 0 9.5 | 0.065 | 0.33(f) | |||
| B 0 | 4 | 6.5 | 9 | ||
| B 2 | 1 | 2.5 | 4 | ||
| B 4 | 0.5 | 2.5 | |||
Note. Since the scatter in
measurement is very large, mean values have been give.
| |||||
CIV (see 5801) characterizes O-type stars, with a maximum around 0 7. It has a positive luminosity effect. The same behavior is observed for CIV 5812 (Walborn 1980).
 |
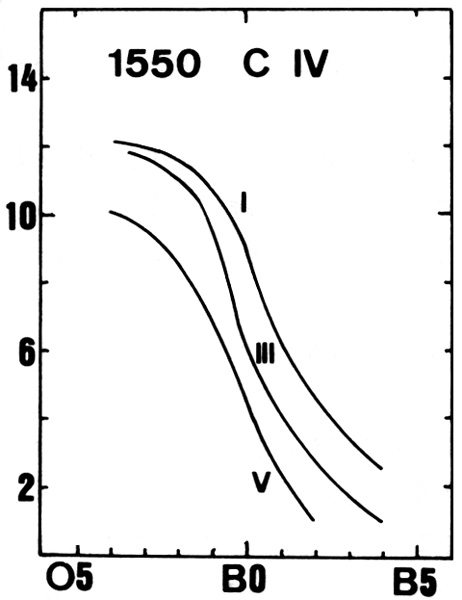
The ultraviolet CIV lines (resonance doublet 1548 and 1550(l)) decrease from 0-type toward B 2, where they disappear (in dwarfs). The feature has a strong positive luminosity effect (Heck et al. 1984). The feature is frequently seen in emission before 13 0, independently of the luminosity.
CIV lines are characteristic of the hottest stars so far known, the pre-degenerates (Werner et al. 1991).
In many-0-type stars, 1550 has a P Cygni profile (or extended blue wings). This fact is interpreted as indicating mass loss from the stellar atmosphere (Howarth and Prinja 1989). In Be Stars the line is visible up to B 5V (Marlborough 1982).
Emission lines of CIV
A strong 5801-5812 (M.1) doublet in emission and a pronounced 4646 absorp- tion of CIV are characteristic of the pre-degenerates (PG 1159 stars) (Motch et a1. 1993).
For WR stars, see below.
When the 1550 line appears in emission in late type stars, it indicates the presence of a chromosphere, or, more properly speaking, of a transition region. The emission is visible in a domain extending from F to K4 dwarfs and giants (see the discussion on coronal stars in Part Two, section 3.2). The limit at K4 coincides approximately with what is found from other chromospheric indicators (Haisch 1987).
 |
The carbon sequence in Wolf Rayet stars
A WR star exhibiting strong emission lines of carbon is called a WC star. Carbon is present in the form of CIII and CIV. The most important emission features are CIV 5801-12 (whose average wavelength is often quoted as 5808), which has equivalent widths between 2300 and 10 Å, with a clear tendency to exhibit the largest W in early type (WC 5 and 6) stars.
Another feature, which appears in strong emission, is the blend of CIII 4650, CIV 4658 and HeII 4686, with average wavelength 4650. This feature has W between 1300 and 10 Å. Another feature present in strong emission is C III 5696 (W between 1000 and 30 Å). Usually, but not always, He I at 5876 (W between 170 and 7 Å) and O III + OV at 5592 (W between 400 and 5 Å) are also present.
It should be added that no nitrogen lines are seer! in WC stars (Conti and Massey 1989).
In the infrared spectral region one also finds the same atomic species in emission. One thus finds HeII 10124 (W up to 260 Å) in practically all stars, except a few late WC stars. C II is present at 7236, 9234 and 9891; the first line being the most intense one (W up to 500 Å). This species is absent in early WC stars. C III is represented by 6742, 8500, 8665 and 9711, the last one being the most intense (W up to 1000 Å). This species is present in practically all WC stars. CIV is represented by 7061, 7726 and 8859, the most intense being 7726 (W up to 280 Å). These lines are present in practically all WC stars (Conti et al. 1990). The presence of C III and C IV was confirmed in the 1-3 µm region by Fenens et al. (1991), who detected several features corresponding to both species. Smith and Hummer (1988) add also emission lines of Si f, C II and O V and O VI in the 1-3 µm region.
In the ultraviolet, finally, one finds again the same species in emission: C IV (very strong emissions), C III and C II (the last two preferentially in the later subclasses) and He II (1640 in very strong emission). In addition one also sees emissions of C V in the earlier subclasses, OV and OIV, Si IV (1402) and Fe V, Fe IV and Fe III. For details see Willis et al. (1986). Nitrogen is again absent in the ultraviolet spectral region.
Behavior in other non-normal stars
C is usually weakened in sdO and sdB stars in which He is weak. For instance C II (4267) has W smaller by a factor of two or more (Baschek and Morris 1970). When He is strong, C is normal or strong (Husfeld et al. 1989). A strong ultraviolet C II 1335 line is characteristic of fee-strong objects Qaschek and Jaschek, unpublished).
sdO stars with strong He may also have C enhanced (Rauch et al. 1991). C IV lines (1548 and 1550) are strongly enhanced in CNO stars of the carbon variety (by factors of 2-3), whereas they are weakened in those of the nitrogen variety (Walborn and Panek 1985).
C III lines are weakened by factors of 2-3 in nitrogen-enhanced CNO stars (Schoenberner et al. 1988).
C lines show a variety of behaviors in the central stars of planetary nebulae. Many but not all of the H-deficient subgroup show large C overabundances and there exist also indications of a variety of C strengths in the H-rich subgroup. The lines can be observed both in emission and in absorption (Mendez 1991).
C is very overabundant in pre-degenerate stars (Werner et al. 1991, Werner 1991).
C I and C II have been analyzed in early type stars by Roby and Lambert (1990). On average C is about normal in Bp stars of the Hg-Mn and Si subgroups, but seems slightly weak in Bp stars of the Cr-Eu-Sr subgroup (W values less by a factor of four or thereabouts).
C is about normal in Am stars (Boyartchuk and Savonov 1986).
The ultraviolet lines of C I (1657 and 1931) are very strong in lambda Boo stars (Baschek et al. 1984).
C is weak in most of the HB stars (Lamontagne et al. 1985).
The abundance of C has been investigated by Boesgaard and Friel (1990) in E-type stars covering a wide range in age. No trend of C with Fe is apparent.
C I absorption lines are strong in the principal spectrum phase of novae , whereas C II lines are prominent in the Orion spectrum phase (Payne-Gaposchkin 1957). Emission lines of CII, C III and C IV are present in the ultraviolet region (Warner 1989). In general C is overabundant by one order of magnitude in novae of the C-O subgroup (Andreae 1993).
In late type stars C is not easily observable, except as the molecules C2, CH, CO and CN. These molecules have numerous strong bands in the classical region and dominate the infrared region.
Carbonated molecules (in wanner stars C2 and CN, in cooler stars HCN and C2H2) are especially strong in the so-called C stars, formerly also called R (warmer) and N (cooler) stars, see Jaschek and Jaschek (1987a). In fact the explanation of the existence of C stars invokes the fact that more C atoms than 0 atoms exist in the atmospheres of these giant stars. The O atoms are then used to form CO molecules, with no O atoms left for oxygenated molecules like TiO, VO and ZrO, which are characteristic of M-type stars. The explanation that, in oxygen-rich giants, all C is locked up in CO is true in general, except in the coolest and densest atmospheres, where the C is locked up mostly in CH4 (Tsuji 1964).
M stars and C stars are found over the same temperature interval, but M-type stars are about 100 times more frequent than C stars. C and M stars are the result of the (different) evolution that the stars have undergone. The C/O ratio is, however, not the same in all C stars and it may vary in the range 1-5 (Kilston 1975, Dominy 1984). In the sun this ratio is 0.6. Later work by Lambert et al. (1986) has shown that the high ratios in C stars are probably spurious and that the C/O ratio is less than 1.6. Green et al. (1991) and Warren et al. (1993) have discovered a small number of dwarf carbon stars.
Usually the C giants are surrounded by circumstellar shells which are
rich in
carbon, characterized by an emission feature at 11.0-11.5 µm
attributed to silicon carbide. Only a few exceptions to this rule are
 -type stars
(Lloyd Evans 1991,
Barnbaum et al. 1991,
Lorenz Martins and Codina 1992).
For a definition
of J-type stars, see the discussion under carbon isotopes.
-type stars
(Lloyd Evans 1991,
Barnbaum et al. 1991,
Lorenz Martins and Codina 1992).
For a definition
of J-type stars, see the discussion under carbon isotopes.
A cautionary remark must, however, be made. If the relative abundances of C and O were the factor determining the existence of carbonated or oxygenated molecules, then it would be impossible to explain how some variables can change from S to C stars (Lambert 1989.) An S star is a star of the oxygen sequence, where the TiO bands have been replaced by those of ZrO. It is thus not certain that owhat we see on the surface of the star is in all cases what nucleosynthesis has fabricated in the interior of the star. In Ba stars, the CH and C2 bands are moderately enhanced (Bidelman and Keenan 1951), which leads to a moderate overabundance of C. CI lines are strengthened in the spectrum of R CrB stars (Cottrell and Lambert 1982) and also in the so-called hot R CrB stars (Jeffery and Heber 1993).
C has been analyzed in normal (i.e. not metal-weak) K5 - M6 giants by Lazaro eta l. (1991) using the 2.3 µm band of CO. They find a systematic depletion of C with respect to the sun, the average deficiency being -0.6 dex.
C is weak in the weak G-band stars (Cottrell and Norris 1978).
C seems to behave in a manner parallel to that of Fe inmetal-weak stars (Carbon et al. 1987, Wheeler et al. 1989) although this is not established. Some authors think that C becomes overabundant with respect to Fe in extremely metal-wek stars.
In globular cluster giants, measurement of CN strengh has shown that the behavior of C varies from one cluster to another, even at the same Fe/H ratio (Langer et al. 1992) Several authors have suggested correlations of C with either the Fe/H or the C12/C13 ratio, or an anticorrelation with N. Since most of these studies are based on a small number of objects it seems best to consider this problem as being solved.
C seems to vary in a manner parallel to that of Fe in the stars of the Magellanic Clouds (Barbuy et al. 1981, Spite and Spite 1990).
An interesting group is constituted by the hydrogen deficient carbon stars. This is a small group of stars, first defined by Bidelman (1953), which exhibit strong CI lines and strong C2 and CN bands, as well as very weak or absent H lines and weak or absent CH bands.
Carbon isotopes Carbon has seven isotopes, among them two stable ones, namely C12 and C13, and the short-lived C14 (half life 5.7 × 10³ years). In the solar system the ratio C13 / C12 is of the order of 1.1 × 10⁻². The easiest way to study this ratio in stars is to look at the behavior of molecules like CN, CO, C2 and CH, which may be formed with C12 and C13 isotopes. The following band heads have frequently been used:
| 4744C | C12 C13 |
| 4753 | C12 C12 |
| 6206 | C12 N14 |
| 6260C | C13 N14 |
| 8004 | C13 N14 |
| 8010 | C12 N14 |
Sanford (1929) was the discoverer of the C12 C13 bands and he concluded correctly that this implied anomalies in the isotope ratio C12 / C13. This originated a large number of studies in which a wide variety of isotope ratios has been found. For instance in C stars the ratio C12 / C13 varies in the range 3-20 (Kilston 1975, Dominy 1984). Lambert et al. (1946) found that the ratio lies, in general, between 30 and 70. Stars very rich in C13 are rather exceptional.
It seems also that there exists a progression of C12 / C13 ratios from M, MS, S, SC and C stars. Whereas for M stars this ratio is of the order of 13, it is 60 for early C stars. However, not all authors agree with this conclusion - see for instance Lazaro et al. (1991).
It has also been suggested that the isotope ratio is a function of the strength of the iron peak elements (Sneden 1991).
Jorissen (1944) finds ratios between 8 and 24 for Ba stars. Tsuji et al. (1991) find very high ratios in some CH stars and suggest that these ratios are related to the strength of the C2 bands, in the sense that ratios are high if C2 bands are strong.
Cottrell and Lambert (1942) find very high C12 / C13 ratios in R CrB stars.
Schild et al. (1992) have investigated the ratio in symbiotic stars and find that it is undistinguishable from that in normal red giants.
Fix and Cobb (1947) studied the C12 / C13 ratio in one OH maser and found a ratio of about 10.
Other molecules have also been used to derive the C12 / C13 ratio, like for instance CS and SiC2 (Cernicharo et al. 1991b), and one can add the use of CO and HCN.
X111 these studies present many difficulties from a theoretical viewpoint - for a discussion of some of the difficulties, see Gustafsson (1949).
Carbon isotope ratios in globular cluster stars have also been studied several times - see for instance Suntzeff and Smith (1991).
There exists a group of stars - the so-called J stars - whose isotopic ratios are very anomalous. The J stars were defined by Bouigue (1954) as carbon stars in which the C13 / N14 band is very conspicuous, which can happen only if the C12 / C13 ratio is rather low.
Early J stars show weaker Sr, Y, Zr and Ba lines than C stars of the same temperature, whereas this does not happen in late J-type stars (Dominy 1945).
Up to now, no definite evidence for the existence of C14 in stars has been found (Gustafsson 1989), despite a careful search made in C, M and SM stars on the basis of the CO band at 4130 cm-1 (Harris and Lambert 1947).
Origin
C12 is produced by He burning and C13 by hydrogen or by hot hydrogen burning.
Published in "The Behavior of Chemical Elements in Stars", Carlos Jaschek and Mercedes Jaschek, 1995, Cambridge University Press.