Copyright © 1992 by Annual Reviews. All rights reserved
| Annu. Rev. Astron. Astrophys. 1992. 30:
429-456 Copyright © 1992 by Annual Reviews. All rights reserved |


4.3 Constraints from the Isotropy of the X-Ray Background
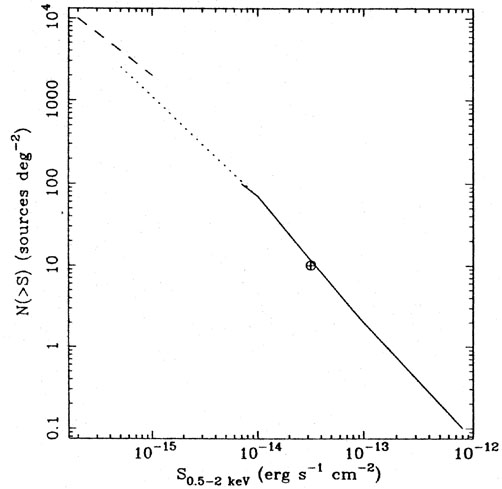
As mentioned already, the observed isotropy of the XRB provides strong constraints on the contribution of AGN. The first limit came from an analysis of variance of the fluctuations in deep images from the Einstein Observatory IPC made by Hamilton & Helfand (1987). This showed that the (1-3 keV) X-ray source counts must flatten just below the so-called Deep Survey level (~ 2.6 x 10⁻¹⁴ erg cm-2 s-1 in the 1-3 keV band) at which the faintest sources could be directly resolved (Figure 7). An independent P(D) analysis by Barcons & Fabian (1990) of the same images obtained a similar result. Soltan (1991), using a wider selection of data from the same images, does not find any need for a flattening in the source counts, although his statistical approach (which involves the variance measured from the ACF) may not be especially sensitive to faint source counts. Basically, background fluctuations are expected from the unresolved sources in the field, and the data showed that these fluctuations are smaller than expected if the source counts continued to much fainter flux levels. Such a flattening of the source counts was expected (Schmidt & Green 1986, Barcons & Fabian 1990) since most of the Deep Survey sources are identified with faint quasars (Griffiths et al 1987) and optical quasar number counts flatten off below 22nd magnitude. The residual background must then be very smooth on the arcmin scale, requiring more than 2000 sources per square degree.
|
Figure 7. Source counts in the soft band
(0.5-2 keV). Data from the EMSS
of Gioa et al (1990a)
(solid line) and the Einstein Observatory Deep
Survey (Griffiths
et al 1987,
Primini et al 1991)
(cross). The dotted
curve shows an extrapolation of N( > S)
|
The ROSAT images obtained by Hasinger et al (1991) and by Shanks et al (1991) confirm this flattening of the source counts. The flattening, at a flux level too high to account for all the XRB intensity from brighter sources, emphasizes that sources contributing to imaging surveys are not the origin of all the XRB. The results clearly demonstrate the utility of fluctuation analyses, particularly of the P(D) analysis, for indicating the trend of the source counts at levels an order of magnitude or so below that at which direct counts can be made, as the analysis, made many times in the radio band has shown (e.g. Wall et al 1982). Future work on the fluctuations in the deepest ROSAT images will therefore show the trend of the source counts at levels down to < 10-15 erg cm-2 s-1.
The results from the current imaging surveys apply to the band that is
softer than the main 3-100 keV XRB band. The fraction of the XRB
estimated from sources contributing to the observed soft X-ray source
counts above the level at which the counts flatten is about 50% of the
intensity obtained by extrapolating the above 3 keV spectrum to lower
energies with a power law index of 0.4. Since an excess is measured in
the spectrum in the 0.3-3 keV band, it is not clear whether the soft
X-ray sources contribute at any significant level to the XRB above 10
keV or so; perhaps they only constitute the soft extragalactic excess
background. It may well be that the origin of most of the soft XRB is
completely different from that of the hard
( 3 keV) XRB.
A point that emphasizes this fact is the mismatch between the Medium Sensitivity Survey counts and the P(D) fluctuation analysis from Ginga, which predicts three times more sources than the Medium Sensitivity Survey counts (Figure 8). Photoelectric absorption of a significant fraction of all hard X-ray sources (at a level which is consistent with spectra of the fluctuations and with observations of Seyfert galaxies) might reduce this prediction just enough (Butcher et al 1992). Broadband studies are particularly desirable here.

|
Figure 8. Source counts in the 2-10 keV
band normalized to the
relationship expected in a Euclidean universe. The filled points are
from the direct counts of
Piccinotti et al
(1982).
The dotted contour is
the 1 |
The deep X-ray images to be made in the next few years at energies of
0.1-12 keV with ASTRO-D, Spectrum-X- , AXAF, and other missions will be
very important in determining the overall contribution of AGN and other
sources to the XRB. The flattening of the ROSAT counts suggests that
such images may not be confused, even if the spatial resolution for
several of the instruments is relatively low (one to two arcmin).
, AXAF, and other missions will be
very important in determining the overall contribution of AGN and other
sources to the XRB. The flattening of the ROSAT counts suggests that
such images may not be confused, even if the spatial resolution for
several of the instruments is relatively low (one to two arcmin).
Some limits on excess fluctuations have been obtained at higher
energies (3-12 keV). These are fluctuations in excess of those expected
from sources that are just not resolved and require that the sources
contributing most of the XRB do not cluster on scales
10 Mpc. Stronger
limits have been obtained from ACF analyses of the XRB in the HEAO-1
(Persic et al 1989,
De Zotti et al 1990)
and Ginga data (Carrera et al
1991, 1992). This last work allows only 70% of the XRB to originate in
sources at redshifts of 0.5 to 3 with a correlation length exceeding
6h-1 Mpc. This length is important since
Boyle (1991)
finds that 400
optically-selected quasars (with redshifts out to 2.5) have a constant
comoving correlation scale of ~ 6h-1 Mpc
(H0 = 100h km s-1 Mpc-1).
As a final point, it should be noted that the good correspondence between the P(D) results and the direct counts in the soft X-ray band, together with the observation that the counts flatten, leaves little room for excess fluctuations in the soft XRB. This probably rules out any significant contribution in that band from either distant clusters of galaxies or a clumpy intergalactic medium.
 S-1.2
from ROSAT work (e.g.
S-1.2
from ROSAT work (e.g.
 region from a
HEAO-1 A2 fluctuation analysis
(
region from a
HEAO-1 A2 fluctuation analysis
(