Copyright © 1992 by Annual Reviews. All rights reserved
| Annu. Rev. Astron. Astrophys. 1992. 30:
429-456 Copyright © 1992 by Annual Reviews. All rights reserved |


As far as the spectrum of the XRB is concerned, we can split the X-ray band into several parts where different components may dominate the observed intensity.
At the softest energies (0.1-0.5 keV, i.e. 120-24 Å) most of the background is Galactic and probably due to the local bubble which has a temperature of about 106 K (McCammon & Sanders 1990). Interstellar absorption prevents a large fraction of any extragalactic component from being directly observed. Interesting limits to any extragalactic intensity at 0.25 keV have been obtained by using the LMC to shadow this component against the local one (see McCammon & Sanders 1990). Some recent ROSAT observations of optically-thick Galactic clouds have detected some strong shadows (Burrows & Medenhall 1991, Snowden et al 1991). The results, however, are still difficult to interpret since these clouds are only a few 100 pc away and any Galactic halo emission is also shadowed.
The best-measured part of the XRB spectrum is the 3-300 keV band (i.e.
4-0.04 Å). The HEAO-1 A2 experiment provided a very precise
measurement of the XRB spectrum from 3 to about 45 keV
(Marshall et al 1980).
In this band, the spectrum is well-fitted by a ~ 40 keV thermal
bremsstrahlung model. In
 2 terms, this was a
better fit than a
blackbody spectrum to the pre-COBE measurements of the MWB intensity
(De Zotti 1982).
This remarkable fact led some workers to seriously consider
that this was not a coincidence, but that it had some physical meaning
(see Section 5). A simple analytical fit to
the XRB spectrum in this band is
(Boldt 1987)
2 terms, this was a
better fit than a
blackbody spectrum to the pre-COBE measurements of the MWB intensity
(De Zotti 1982).
This remarkable fact led some workers to seriously consider
that this was not a coincidence, but that it had some physical meaning
(see Section 5). A simple analytical fit to
the XRB spectrum in this band is
(Boldt 1987)
Over the 3 to 10 keV band, where the most data on the XRB has been
accumulated, an equally good fit is provided by a power law
[I(
The HEAO-1 A4 experiment also measured the XRB spectrum from 15 keV to
6 MeV
(Gruber et al 1984).
A slight mismatch with the A2 data in the
40-60 keV range was shown to be a calibration problem and there is now
good agreement in the overlapping band
(Gruber 1992).
An empirical fit
to the XRB spectrum from 3 keV to 6 MeV has now been obtained by Gruber
(private communication); from 3 to 60 keV,
and from 60 keV to 6 MeV, two power laws can be added
The scatter of the data about this function increases by about a factor
of 2 each half decade of energy, from about 2% at 3-120 keV to 60% at
1-3 MeV.
Above the highest energy characterized by this fit, there is a
spectral point at ~ 35-100 MeV from SAS II data
(Fichtel et al 1978).
Depending on the (unknown) contribution from our Galactic halo, this can
either be seen as a limit or a measurement of the extragalactic
intensity at that energy. The peak in
The spectral band from 0.5 to 3 keV is of special interest because
neither interstellar absorption nor the Galactic contribution are very
important and all the imaging X-ray telescopes used so far have
concentrated in this band. The spectrum of the XRB in this band was
often assumed to be an extrapolation of the
Figure 4. The intensity spectrum I
The detailed shape of the XRB spectrum from this band up to ~ 10 keV
will soon be determined from measurements made with the shuttle-borne
Broad Band X-ray Telescope (BBXRT;
Serlemitsos et al
1991).
The spectrum of the XRB
(Figures 3 and
4) is therefore characterized
by at least 3 components: a steep power law below 3 keV, an exponential
of 40 keV, and a broken power law at higher energies. Whether the origin
of these is dominated by separate classes of objects or by separate
physical mechanisms is not yet clear. Most of the energy density is
contained between 20 and 40 keV (see
Figure 3). As already mentioned,
most of the data on the XRB refer to the 3-10 keV range which contains
about 20% of the total energy. Most extragalactic X-ray sources have
been discovered by imaging instruments (the Einstein Observatory,
EXOSAT, and ROSAT) at

 )
)  -
- ]
with energy spectral index of 0.4.
]
with energy spectral index of 0.4.


 I at a few
MeV is known as the ``MeV bump.''
-0.4 law from higher
energies, although the normalization has been uncertain (see
Figure 4).
However, the detection of many steep spectrum sources (QSOs and clusters
of galaxies) was highly suggestive of a soft excess in this band (such
as first reported by
Garmire & Nousek 1981).
This is now confirmed by a
sophisticated analysis of Einstein IPC data
(Wu et al 1991)
and also by ROSAT data
(Hasinger et al 1991,
Shanks et al 1991).
Both measurements
are consistent with a power law with energy spectral index ~ 0.7-1 over
this band. This makes the XRB at 1 keV about twice that expected from
the extrapolation from higher energies.
I at a few
MeV is known as the ``MeV bump.''
-0.4 law from higher
energies, although the normalization has been uncertain (see
Figure 4).
However, the detection of many steep spectrum sources (QSOs and clusters
of galaxies) was highly suggestive of a soft excess in this band (such
as first reported by
Garmire & Nousek 1981).
This is now confirmed by a
sophisticated analysis of Einstein IPC data
(Wu et al 1991)
and also by ROSAT data
(Hasinger et al 1991,
Shanks et al 1991).
Both measurements
are consistent with a power law with energy spectral index ~ 0.7-1 over
this band. This makes the XRB at 1 keV about twice that expected from
the extrapolation from higher energies.
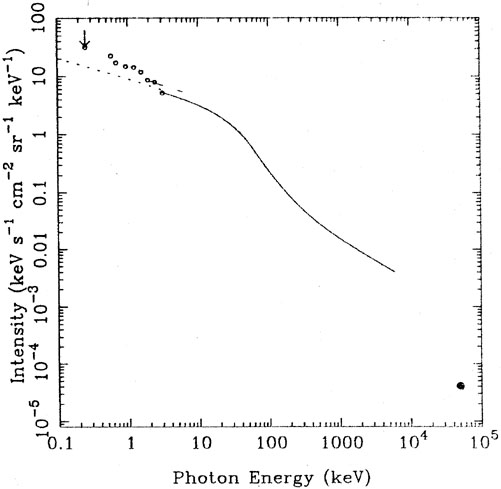
of the XRB. The dotted line
represents an extrapolation of
Boldt's (1987)
formula to the lower
energies of the soft X-ray background. The dashed line over the 2-6 keV
band represents I = 11 -0.4 keV s-1 cm-2
sr-1 keV-1
(McCammon & Sanders
1990).
The 1/4 keV limit is from
McCammon & Sanders
(1990)
and the circles are the IPC spectrum from
Wu et al (1991).
ROSAT data appear to agree with
this last spectrum.
 3 keV where only a few
per cent of the energy
of the XRB is contained. This makes the issue of the origin of the XRB
more complicated. The simplest band to explain (possibly due to its
paucity of extragalactic data) is that above a few 100 keV, where the
XRB is probably due to the unresolved emission from AGN
(Bignami et al 1979,
Rothschild et al 1983).
The shape of the XRB there has often been
used to infer a break in the spectra of AGN in order that the
extragalactic background measured at a
3 keV where only a few
per cent of the energy
of the XRB is contained. This makes the issue of the origin of the XRB
more complicated. The simplest band to explain (possibly due to its
paucity of extragalactic data) is that above a few 100 keV, where the
XRB is probably due to the unresolved emission from AGN
(Bignami et al 1979,
Rothschild et al 1983).
The shape of the XRB there has often been
used to infer a break in the spectra of AGN in order that the
extragalactic background measured at a
 10 MeV is not overproduced.