

We now enter the most interesting and perhaps most important issue of the Virgo cluster structure: the interaction between the M87 and M86 subclumps. The galaxy M86 has long been known to interact with the intracluster medium (ICM) of the Virgo cluster: Forman et al. (1979) discovered a plume in the X-ray structure of M86, which they inetrpreted as being due to ram pressure stripping of the hot gas of M86 by the Virgo ICM. This general picture has recently been confirmed by Rangarajan et al. (1995) based on ROSAT data, although these authors find no evidence for a cooling flow associated with an apparent optical emission seen on very deep photographs (Nulsen & Carter 1987). The surprisingly high metal abundance in the X-ray plume is attributed to the destruction of dust in the stripped material. From the morphology of the X-ray structure of M86, Rangarajan et al. (1995) estimate a southward velocity of M86 in the plane of the sky of ca. 500 km s-1, in addition to the radial velocity, relative to M87, of almost -1500 km s-1 (cf. Table 1).
However, we probably do not deal with a single galaxy, M86, that is plunging through the Virgo ICM at a high relative speed and thereby suffering ram pressure stripping. The large gas fraction of M86 is more typical for a whole group of galaxies (Böhringer et al. 1994). A first hint at the existence of a such a group, or rather the ``M86 subclump'' of galaxies, was found in the velocity distribution of dwarf ellipticals (Binggeli et al. 1993). So we have a small X-ray cluster, the M86 subclump, which is banging into a big X-ray cluster, the M87 subclump (note that this is more specific than the ``Virgo ICM''), from the back.
Let us have a closer look at the velocities of dwarf ellipticals just mentioned. The velocity distribution of dEs was shown in Fig. 4, and attention was drawn to the fact that this distribution is asymmetric, with M87 coinciding with the peak at higher-than-average velocities, and with a long tail of low velocities around the velocity of M86. This asymmetry was taken as evidence for the ongoing merging of the M87 and M86 subclumps.

|
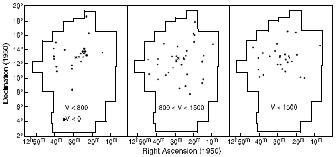
Figure 7. The distribution of dwarf ellipticals in the Virgo cluster shown for three different velocity ranges: low velocities (v < 800) in the left panel, velocities close to the cluster mean (800 < v < 1500) in the central panel, and high velocities (v > 1500) in the right panel. Velocities are heliocentric and in km s-1. The irregular contour is the boundary of the Las Campanas Virgo cluster survey (Binggeli et al. 1985). The position of M87 is indicated by a cross. Note the concentration of high-velocity and low-velocity dEs to the right of M87. In particular, there is a clustering of dEs with negative velocities around M86 (drawn as fat dots). Figure taken from Binggeli et al. (1993). |
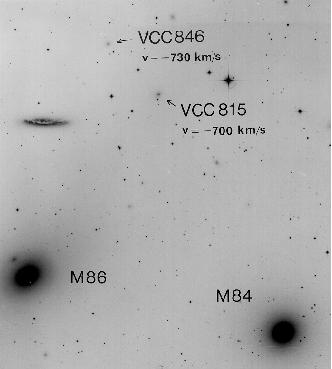
That the strange distribution of dE velocities is indeed coupled with M87 and M86 becomes more obvious by plotting the projected positions of the dwarfs in the cluster for different velocity ranges. This is shown in Fig. 7. Two features are striking: (1) there is a strong clustering of low-velocity dEs, in particular negative-velocity dEs, to the NW of M87, around M86, (2) there is a concentration of high-velocity dEs to the W of M87. The dEs with negative velocities are interesting in themselves, because two of them are, in fact, the most blue-shifted galaxies known in the sky! Although there is good reason to hunt for the most red-shifted galaxies in the universe, it is only just that these blue-record holders are finally portrayed - which I do in Fig. 8.

|
Figure 8. A small piece of the Virgo cluster reproduced from one of the 67 Las Campanas photographic plates used for the Virgo cluster survey (Binggeli et al. 1985), showing M84, M86, NGC 4402, and a number of inconspicuous dwarf galaxies, two of which, however, are the most blue-shifted galaxies in the whole sky known to date: VCC 815 and VCC 846 with heliocentric velocities of -700 and -730 km s-1, respectively. The scale of the photograph is given by the angular distance between M84 and M86, which is 18 arcminutes. |
How can we interpret the concentration of dwarfs to the W of M87?
The dEs with the most negative velocities (v
 - 700 km s-1)
are ca. 500 km s-1 off M86, which we suppose is at rest with respect
to the M86 subclump as a whole. Thus, these dEs could
simply constitute
the low-velocity tail of the M86 subclump, even with a velocity dispersion
that is significantly smaller than 500 km s-1. On the other
hand, one
could envision a rather small intrinsic (original) velocity dispersion
of the M86 subclump, in which case the negative-velocity dwarfs
would have been accelerated by the tidal influence of the M87 subclump.
Conversely, the concentration of high-velocity dEs to the W of M87 could
be due to M87 subclump members that have been tidally accelerated
towards M86.
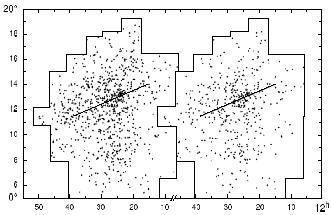
At this point we have, finally, to look at the distribution of all 800 odd dEs in the cluster, not only those for which we have a velocity. This is presented in Fig. 9. We note a very striking clump of dEs in the central region defined by M87 and M86, which is best seen with the very faintest dEs (BT > 18, in the right panel). The feature looks somewhat like a cocoon that is embedding M87 and M86 at its extreme ends. Without modelling, i.e. numerical simulation of the Virgo cluster dynamics with a full account of galaxy morphology, it remains unclear what this dE cocoon, including its kinematic oddities discussed above, exactly means. However, its very existence strongly suggests that these dwarf galaxies are not in equilibrium with the rest of the cluster. We take it as best evidence for the strong ongoing interaction between the M87 and M86 subclumps.

|
Figure 9. The distribution of all 828 dwarf ellipticals (left panel) and of the 476 dwarf ellipticals fainter than BT = 18 (right panel) in the Virgo cluster. The positions of M87 and M86 are indicated by filled circles. The jet axis of M87 is shown as line. The irregular contour marks the boundary of the Las Campanas survey of the Virgo cluster (Binggeli et al. 1985). Note the dense, elliptical-shaped concentration of dEs which fills the area between M87 to M86 along the jet axis of M87. |
But perhaps the most remarkable feature of all is the perfect alignment of the symmetry axis of this interaction, i.e. the elongation of the dE cocoon, or simply the direction from M87 to M86, with the (projected) jet axis of M87. The merging of the two subclumps is taking place on a Mpc scale, while the jet is likely originating from the central pc of M87 - this is a factor of one million difference in scale! To put it bluntly: - how does the jet know of the position of M86?
Recently, a very interesting model has been put forward by West (1994) which might explain the observed coherence of structures from the AGN scale to the large-scale structure of the universe. The top-down chain of events evoked by West (1994) goes roughly as follows. During the early epoch of cluster formation, a central dominant (often a cD) galaxy is built via mergers of smaller galaxies. These mergers proceed in a coherent manner along preferred directions which are related to the large-scale cluster surroundings. As a consequence of this anisotropic formation process, the central galaxy is prolate in shape and has a built-in memory of the shape of its parent cluster. Cold gas falling into the prolate potential well will settle into a disk whose angular momentum vector is aligned with the major axis of the central galaxy. Angular momentum loss results in an inward flow of gas, leading to the creation and feeding of a black hole whose spin axis will be aligned with the angular momentum vector. Radio jets are expected to emanate along the black hole spin axis, and thus will be aligned with the major axis of the central dominant cluster galaxy.
This model explains two observed alignment effects: (1) the shape of the central cluster galaxy tends to be aligned with the surrounding distribution of matter on a scale of ca. 20 Mpc, (2) the radio major axis of strong radio galaxies, defined by the radio lobes, tends to be aligned with the optical major axis. The first effect was found for relatively low redhifts, but it will probably also hold for high-redshift clusters. The second effect is only for high-redshift radio galaxies. At lower redshifts, i.e. later epochs, the radio-optical alignment might be washed out by the relaxation of the stellar component, though West (1994) does give low-redshift examples with a strong alignment, such as Cygnus A. In combination, the two alignment effects lead to a coherence of structures from parsecs to Megaparsecs.
Could the model of West (1994) explain the alignment of the jet axis of M87 with the M87-M86 axis? First, we should note that the major axis of the galaxy M87 is not pointing in this direction, but is rather oriented NNW, ca. 50° off the jet axis (e.g., Weil et al. 1997). However, as we have seen in Sect. 2, the position angle of the galaxy M87 is in accord with a second cluster axis, viz. that defined by the line connecting M87 and M49. In fact, it is in perfect accord with ``Supergalactic Equator'' (cf. Fig. 4 in Binggeli et al. 1987), which is the symmetry axis of the Local Supercluster. Hence the shape of the galaxy M87 is, after all, aligned with its surroundings on a 20 Mpc scale.
But the jet is pointing to M86, or rather: the projection of the jet is. In 3D space, the jet is pointing towards us at an angle of 30° - 40° to the line of sight (Bicknell & Begelman 1996, also Bicknell in this volume). So - is it just a coincidence? Without taking resort to an extremist scenario, such as Arp's (1986, also Arp in this volume), I find this hard to believe. Not only M86 and M84 are lying ``in the way''; there are also M59 and M60 on the other side, and there is a whole chain of ellipticals tracing out the projected jet axis (cf. again Figs. 2 and 3 here, and Figs. 4 and 7 in Binggeli et al. 1987). This is suggesting some kind of causal connection between the orientation of the jet and the distribution of matter on a Mpc scale, be it along the lines of West's (1994) model, or by some yet unknown processes.