


The first Palomar Observatory Sky Survey (POSS-I) was taken on glass plates in red (E) and blue (O) colour from 1950 to 1958. While glass copies are less commonly available, the printed version of POSS-I provided the first reference atlas of the whole sky north of -30° declination down to ~ 20mag. Together with its southern extensions, provided 20-30 years later by ESO in B, and by the UK Schmidt Telescope (UKST) in BJ, it was the basic tool for optical identification of non-optical objects. However, reliable optical identification required a positional accuracy on the order of a few arcsec. A common, but not too reliable, tool for this were transparent overlays with star positions taken from the SAO star catalogue. Major limitations are the low density of stars at high Galactic latitudes and differences in the scale and projection between the transparency and the Palomar print or plate. For higher accuracy than a few arcsec the use of a plate measuring machine was required for triangulation of fainter stars closer to the object in question, but such machines were only available at a few observatories.
Curiously, it was mainly the necessity, around 1983, to prepare the HST Guide Star Catalog (GSC; www-gsss.stsci.edu/gsc/gsc.html), which led to a whole new Palomar Sky survey (the ``quick-V'') with shorter exposures in the V band, which was then fully digitized at STScI with 1.7'' pixel size to extract guide stars for the HST. Later the deeper red plates of POSS-I were also scanned at the same resolution to provide an image database of the whole northern sky. For the first time almost the whole sky was available with absolute accuracy of ~ 1'', but owing to the sheer volume the pixel data were accessible only to local users at STScI during the first years. By the time that they had been prepared for release on 102 CD-ROMs and sold by the Astronomical Society of the Pacific (ASP), the Internet and the WWW had advanced to a point where small extractions of these pixel data could be accessed remotely. Other observatories also employed plate-scanning machines to scan POSS, ESO and UKST surveys at even finer pixel sizes, and some catalogues were prepared that contained several 108 objects detected on these plates. Such catalogues usually include a classification of the object into stars, galaxies or ``junk'' (objects which fit into neither class and may be artefacts). However, such classifications have a limited reliability. They should not be taken for granted, and it is wise to check the object by visual inspection on the plates (or prints or films), or at least on the digitized image. It is important to distinguish between these different media: the glass plates may show objects of up to ~ 1mag fainter than are visible on the paper prints. Thus the pixel data, being digitized from the glass plates, may show fainter objects than those visible on the prints. Moreover, they offer absolute positional accuracy of better than 1''. On the other hand, the pixel size of the standard DSS (1.7'') represents an overriding limitation in deciding on the morphology of faint (i.e. small) objects. Eventually we have the ``finding charts'' which are merely sketches of all the objects extracted from the image, plotted to scale, but with artificial symbols representing the object's magnitude, shape, orientation, etc. (usually crosses or full ellipses for stars, and open ellipses for non-stellar objects). They should not be taken as a true image of the sky, but rather as an indication of the presence of an optical object at a given position, or as an accurate orientation indicator for observers (see Fig. 2 for an example).
In what follows I present a quick guide to the various data products which can be freely accessed now. The Royal Observatory Edinburgh (ROE) offers comprehensive information on the status of ongoing optical sky surveys at www.roe.ac.uk/ukstu/ukst.html (go to the ``Survey Progress'' link). Other places to watch for such information are ``Spectrum'' (the RGO/ROE Newsletter), the ESO Messenger (www.eso.org/gen-fac/pubs/messenger), the STScI Newsletter (www.stsci.edu/ftp/stsci/newsletters/newsletters.html), the Anglo-Australian Observatory (AAO) Newsletter (www.aao.gov.au/htdocs/library/news.html) and the Newsletter of the ``Working Group on Sky Surveys'' (formerly ``WG on Wide Field Imaging'') of IAU Commission 9 (chaired by Noah Brosch, email noah@stsci.edu, a URL at http://pixela.stsci.edu/iauwg/welcome.html is in preparation). See also the chapter by D. Golombek for a summary of plate digitizations available at the STScI.
| 
|
| 
|
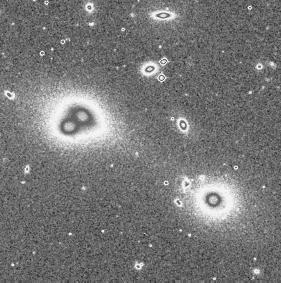
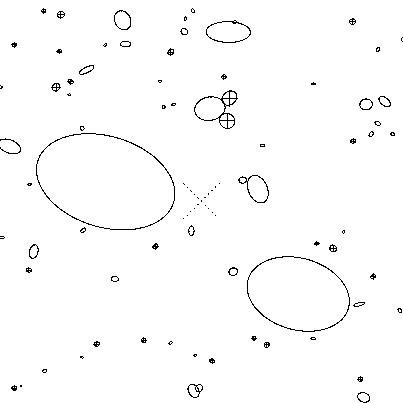
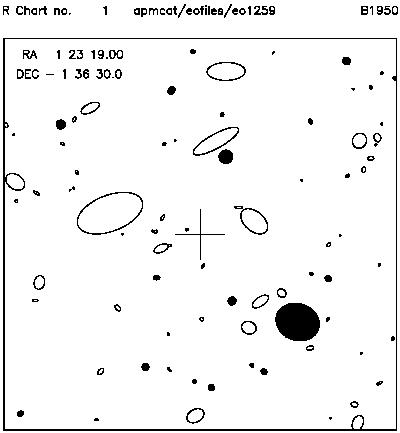
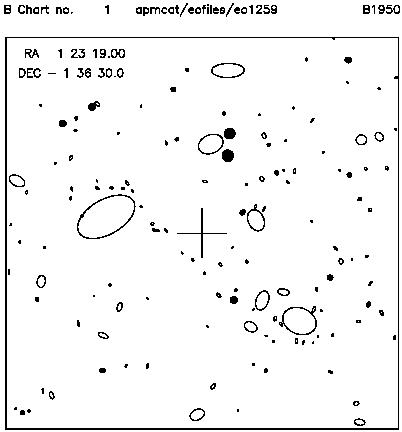
Figure 2. Digitized Sky Survey (DSS) images versus finding charts from object catalogues, for an 8' x 8' region in the core of the galaxy cluster Abell 194. Upper left: DSS image of POSS-I red plate from SkyView; upper right: COSMOS finding chart from BJ plate (open ellipses are galaxies, star-like objects are crossed); lower panels: APM charts from POSS-I, red (R) and blue (B) plate (filled symbols are star-like, open ones are galaxy-like, and the central cross is 1 arcmin wide). Note the different classification of objects in APM and COSMOS and in the R and B scans of APM. Several multiple objects, clearly separated on the DSS, are blended into single, often elongated objects in the APM or COSMOS catalogues. | |